

Read this article in Portuguese.
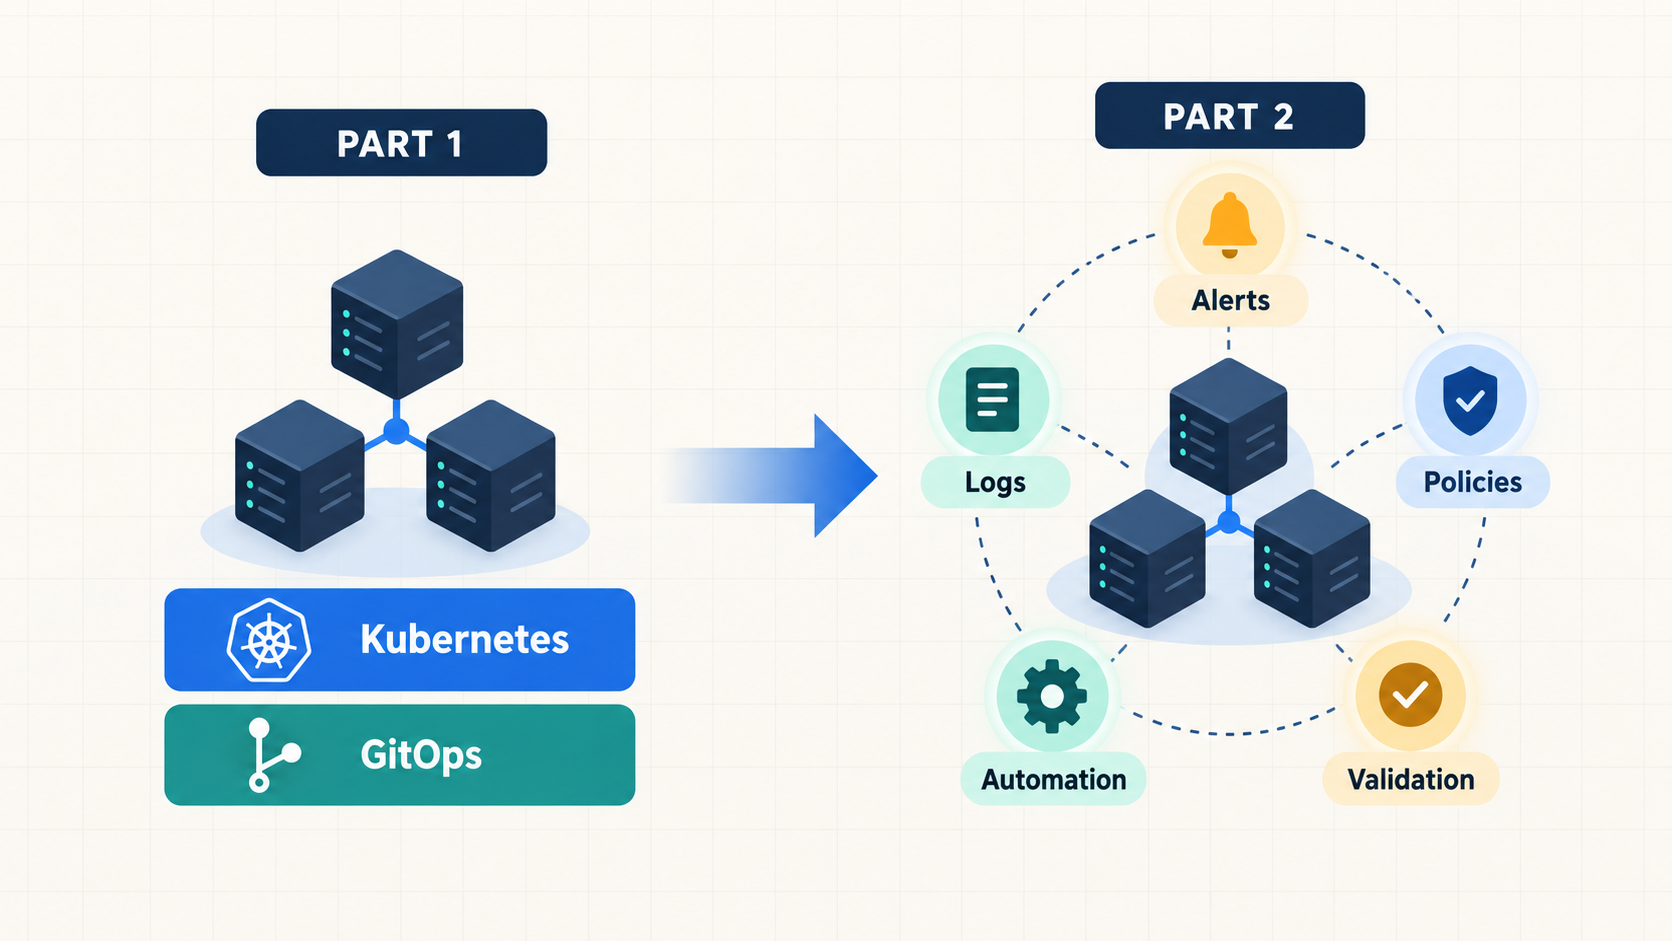
This article continues Home Lab on OCI's Free Tier. In Part 1, I explained how I built the cluster. Now it is time to look at what happened once it began handling real workloads.
There is a huge difference between setting up a Kubernetes cluster and operating a platform.
In Part 1 of this series, my OCI HomeLab already looked fairly complete: OKE with ARM64 nodes, Argo CD managing everything through GitOps, Istio in Ambient Mode, Keycloak centralizing authentication, External Secrets integrated with Bitwarden, and an observability stack built on Prometheus, Grafana, and Kiali.
It was the kind of architecture that looks great in a diagram.
So I did what anyone would do when they realized their lab was stable: I added more stuff to it.
Outline moved to Kubernetes. Renovate began opening updates automatically. Loki and Promtail centralized logs. Kyverno began evaluating policies. Falco started watching runtime behavior. The Istio Gateway began recording public traffic. New dashboards appeared. More services gained SSO.
And, naturally, new ways for everything to go wrong appeared.
This is not a list of tools installed since the first article. It is the story of how each need, failure, and investigation left a permanent improvement in the repository, and how I turned the HomeLab from a functional cluster into a small platform.
Quick summary
In the months after Part 1, the HomeLab grew, broke, and began teaching me. Automated updates, smarter alerts, security policies, and experiments that did not always go as planned turned a functional cluster into a more operable platform.
What you will find here
- how Renovate changed the repository evolution pace;
- why adopting Cilium on OKE required more than installing a chart;
- the Outline migration and the expansion of observability;
- actionable alerts, scanner analysis, Kyverno, and Falco;
- the certificate problem that led to Reloader and metrics-server;
- GitOps validation and a read-only integration between Argo CD and Codex.
The roadmap began to move
At the end of Part 1, Renovate appeared in the “What’s Next” section. Maintaining versions of charts, images and actions manually was still a recurring task. Or, to be honest, a task I remembered to do from time to time.
That was one of the first items to leave the technical-debt list.
Renovate now tracks Helm charts, container images, GitHub Actions, Python dependencies, Terraform providers and even Kubernetes versions. Within a few months, the repository's history began to show something I was unlikely to maintain on my own: small, frequent, and trackable updates.
Argo CD moved through several versions. So did kube-prometheus-stack. Istio, cert-manager, External Secrets, Keycloak, Kyverno, Loki, Ghost, and Outline were continuously updated. Dependencies stopped aging silently.
Automation does not eliminate work; it changes the type of work.
Instead of looking for new versions, I started analyzing changes, validating manifests and correcting incompatibilities introduced by upgrades. This became evident when an update to kube-prometheus-stack changed the behavior of the control plane's ServiceMonitors and broke the rendering of the Application used only to install CRDs.
The solution was not to disable Renovate. It was to improve the separation of responsibilities: the CRD release began rendering only CRDs, without rules, exporters, or ServiceMonitors that depended on Prometheus being enabled.
This has become an important rule for me: automation can find the problem faster, but I still need to clearly express the architecture in the repository.
When Cilium met the limits of the architecture
Not every evolution ends with a new tool running on the cluster.
In April, I began evaluating Cilium as a possible evolution of the HomeLab network. The idea made sense: use eBPF for policies and load balancing, and gain Hubble for network visibility.
The proposal used Cilium 1.17.2, cluster-pool IPAM, a VXLAN overlay, an MTU tuned for OCI, and integration with CRI-O and Istio CNI. During validation, however, it became clear that this was not a simple chart installation. The OKE cluster had been created with OCI_VCN_IP_NATIVE.
In this model, Oracle's plugin assigns addresses from the VCN directly to pods and participates in creating their network interfaces. By treating Cilium as a replacement, with its own IPAM and overlay, two systems could take ownership of different parts of pod networking.
In a managed cluster already running workloads, a mistake at that layer could affect every application and leave new pods without enough connectivity to run the fix itself. I decided to stop the change and revert the manifests.
At the time, I associated part of the limitation with the lean Free Tier environment. The main issue, however, was architectural: replacing the VCN-native CNI of an existing OKE cluster required much more planning than installing Cilium through Argo CD. Today, the project documents a chaining mode for this scenario, keeping OCI CNI responsible for interfaces and addresses while Cilium adds eBPF, policies, and visibility.
Cilium did not enter the cluster at that stage, and that was also part of the HomeLab's evolution. The lab allowed me to test the hypothesis, identify the risk, and record a safer path for a future experiment.
What lived outside moved into the cluster
In Part 1, Outline was still in transition. The application ran on Docker Compose, sharing a VM with PostgreSQL, Redis and MinIO.
The Kubernetes migration finally happened.
Outline gained its own chart, declarative resources, Istio integration, Keycloak authentication, and Secrets synchronized by External Secrets. WebSockets required specific routing and timeout adjustments. MinIO access needed path-style configuration. External URLs and OIDC redirects had to be corrected until every part of the chain agreed that the service was really using HTTPS.
None of those changes is particularly dramatic in isolation. Together, however, they show the difference between “starting a container” and integrating an application into a platform.
The application needed to talk to identity, network, storage, observability and Secrets management. When it finally entered the cluster, it wasn't just a runtime change. It began to participate in the same operational model as the other services.
Dashboards do not page anyone
Prometheus, Grafana, and Kiali had existed since the first version of the HomeLab. I had metrics, graphs, and a view of the service mesh topology. Technically, I had observability.
In practice, it still depended on someone opening a dashboard and noticing that something looked wrong.
This model worked while I was looking at the lab. The problem was simple: I didn't spend the day looking at my HomeLab dashboards, and I shouldn't have.
The stack evolved in two directions.
The first was broader collection. I added ServiceMonitors for Argo CD, cert-manager, Kyverno, External Secrets, ExternalDNS, Keycloak, and Kiali. Loki and Promtail centralized logs, using MinIO as S3 storage. Istio Gateway access logs gained dedicated pipelines to extract host, status, source, and destination.
The second was turning data into actionable signals. Grafana Alerting centralized rules and began sending email notifications. I revised basic alerts to reduce noise: counting restarts was not enough to identify CrashLoopBackOff, and looking only at Pending pods missed Running pods that never became Ready.
I also added alerts that try to look slightly ahead:
- sustained high CPU usage while ignoring short spikes;
- PVCs with less than 10% space;
- Argo CD applications degraded or out of sync;
- certificates close to expiration;
- critical Falco events and Kyverno policy blocks.
Critical alerts gained shorter pending periods and more frequent reminders. Warnings received more tolerance. The goal changed from “notify me about everything” to “notify me when something is worth interrupting my work.”
The internet eventually finds everything
As soon as I published the first endpoints, scanners started hitting them. It didn't matter if it was a personal blog, a login page, or a newly published service. The internet found them all.
The Istio Gateway access logs made this very clear: attempts to access .env files, Git directories, administration panels, framework endpoints, backup files, and known vulnerability paths appeared regularly.
In the latest analysis, I queried 15 days of traffic across every public host. The script evaluated 49,974 entries and separated 3,267 requests to sensitive paths and another 1,253 suspicious requests for review. Those numbers do not mean data was exposed. Many responses were application redirects or fallbacks, but the volume made it clear why the edge needed to learn from its own traffic.
GET /.env HTTP/1.1 403 rbac_access_denied_matched_policy[policy[block-scanner-probes]-rule[0]] host=blog.gabrielandre.com.br
GET /.git/config HTTP/1.1 403 rbac_access_denied_matched_policy[policy[block-scanner-probes]-rule[0]] host=dashboard.gabrielandre.com.br
GET /wp-json/gravitysmtp/v1/tests/mock-data HTTP/1.1 403 rbac_access_denied_matched_policy[policy[block-scanner-probes]-rule[0]] host=blog.gabrielandre.com.br
GET / HTTP/1.1 403 rbac_access_denied_matched_policy[policy[block-scanner-probes]-rule[1]] user-agent="Mozilla/5.0 zgrab/0.x"
The blocks appear as 403 responses generated by the AuthorizationPolicy before the request reaches the application. Rule 0 covers sensitive paths, while rule 1 blocks known scanner user agents. The chart currently maintains 81 path patterns and four user-agent patterns. This is the configuration declared in the repository:
View the complete gateway blocking configuration
security:
  blockScanners:
    enabled: true
    name: block-scanner-probes
    paths:
    - "/.aws*"
    - "/.docker*"
    - "/.env*"
    - "/.git*"
    - "/.npmrc"
    - "/.pypirc"
    - "/.ssh*"
    - "/actuator*"
    - "/adminer*"
    - "/api/actuator*"
    - "/api/.env*"
    - "/app/.env*"
    - "/app/actuator*"
    - "/appsettings*.json"
    - "/backend/actuator*"
    - "/backend/.env*"
    - "/boaform*"
    - "/cgi-bin*"
    - "/config*.json"
    - "/credentials*.json"
    - "/firebase*.json"
    - "/gcp-credentials*.json"
    - "/google-credentials*.json"
    - "/service-account*.json"
    - "/phpinfo.php"
    - "/phpmyadmin*"
    - "/config.php"
    - "/secret*"
    - "/secrets*.json"
    - "*/application.properties"
    - "*/application.yaml"
    - "*/application.yml"
    - "*/config.env"
    - "*/credentials.json"
    - "*/docker-compose.yaml"
    - "*/docker-compose.yml"
    - "*/secret.json"
    - "*/secret.yaml"
    - "*/secret.yml"
    - "*/secrets.json"
    - "*/secrets.yaml"
    - "*/secrets.yml"
    - "*/settings.py"
    - "*/terraform.tfstate"
    - "*/terraform.tfvars"
    - "*/wlwmanifest.xml"
    - "*credentials.json"
    - "*firebase-service-account*.json"
    - "*gcp-service-account*.json"
    - "*google-service-account*.json"
    - "*keyfile*.json"
    - "*service-account*.json"
    - "*service-account-key*.json"
    - "*secret.json"
    - "*secrets.json"
    - "*.properties"
    - "*.yaml"
    - "*.yml"
    - "/internal/actuator*"
    - "/server/actuator*"
    - "/vendor/phpunit*"
    - "/v1/actuator*"
    - "/v2/actuator*"
    - "/wordpress*"
    - "/wp-*"
    - "/wp/*"
    - "/wp-content*"
    - "/wp-includes*"
    - "/xmlrpc.php"
    - "*.php"
    - "*/.git*"
    - "*/.env*"
    - "*/.aws*"
    - "*/.ssh*"
    - "*/.docker*"
    - "*/.npmrc"
    - "*/.pypirc"
    - "*/wp-includes*"
    - "*/wp-admin*"
    - "*/wp-content*"
    - "*/xmlrpc.php"
    userAgents:
    - "TLM-Audit-Scanner/1.0"
    - "libredtail-http"
    - "Mozilla/5.0 zgrab/0.x"
    - "Mozilla/5.0 (compatible; CMS-Checker/1.0; +https://example.com)"
The same analysis suggested 14 AuthorizationPolicy patterns. Every one of them was already covered by the current configuration, so no duplicate rule had to enter the chart. That result is also part of the flow: analysis does not necessarily mean change.
Instead of manually adding blocks after reading a few log lines, I built a repeatable flow. A script queries historical data from Loki, analyzes every public host, identifies sensitive patterns, and compares its suggestions with the paths already blocked by the gateway AuthorizationPolicy.
If a new path appears, it becomes a declarative change on the chart. If it is already covered, no duplicate rules are created.
The interesting part is not the list of blocked scanners. It is the cycle that emerged:
real traffic → logs → analysis → Git change → validation → Argo CDThe HomeLab began learning from its own traffic.
Security on more than one layer
Blocking probes at the gateway protects the edge, but does not respond to what happens inside the cluster.
Kyverno turned conventions into policies. Privileged containers, host namespaces, images tagged latest, missing labels, and absent resource limits stopped being documentation-only concerns. The rules first arrived in audit mode, allowing me to observe their impact before blocking workloads.
Falco added another perspective: runtime behavior. Instead of just asking “should this manifest be accepted?”, it helps to ask “what is this process doing after it started?” Events go through Falcosidekick, reach Loki and also feed metrics and alerts into Grafana.
I did not turn the HomeLab into a SOC. The idea was simpler: explore how admission policies, runtime detection, logs, and alerts complement one another, and learn how much of that could fit on two Free Tier ARM machines.
The certificate was renewed, and yet everything stopped
The most recent improvement started with a problem that seemed contradictory.
ExternalSecrets were not syncing. ClusterSecretStore showed an error when fetching data from the Bitwarden provider. The first natural suspicion was credentials, connectivity or some change in the API.
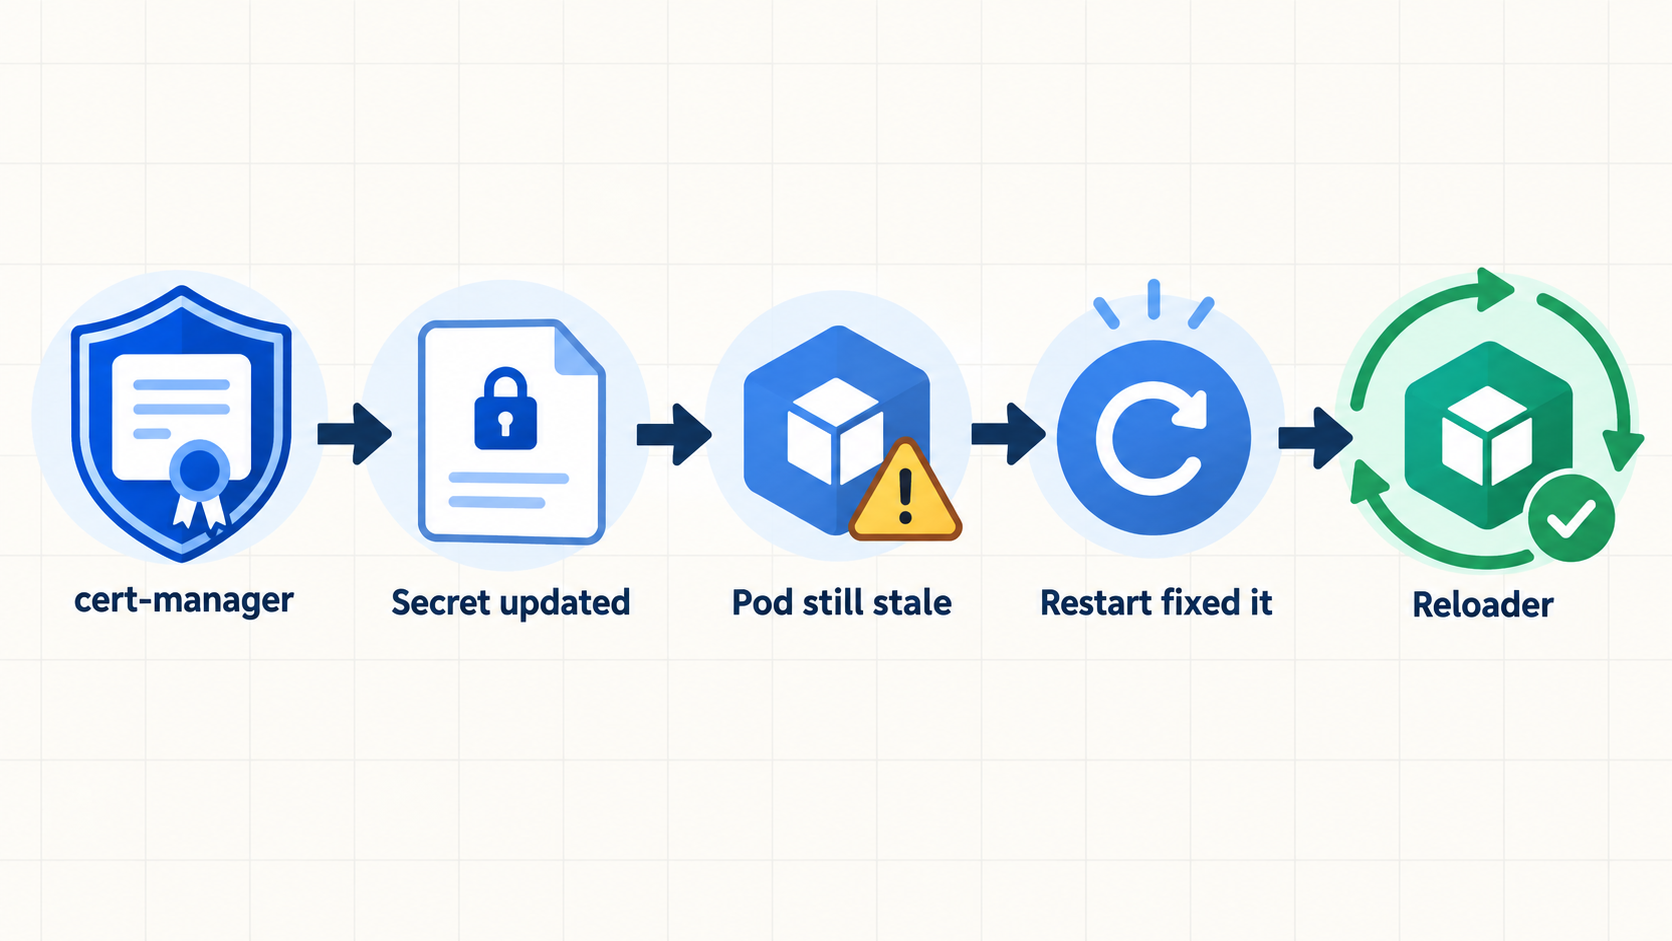
cert-manager, however, showed that the Bitwarden SDK certificate was valid. It had been renewed correctly, remained within its validity period, and the Kubernetes Secret contained the new certificate. Still, the service did not work.
The clue appeared when I compared dates: the certificate had been renewed in August, but the Bitwarden SDK pod had been running for 46 days. The Secret mounted in the volume had been updated; the process had not.
cert-manager did its job. Kubernetes updated the Secret. But nothing restarted the application so it could load the new TLS material.
A rollout restart immediately resolved the problem. ClusterSecretStore became Ready again and, after I forced reconciliation, every ExternalSecret resumed synchronization. But manually restarting the pod would only solve the problem for that night.
The permanent fix was to add Reloader through GitOps and explicitly annotate the Bitwarden SDK Deployment to watch the TLS Secret. On future renewals, a Secret change will trigger an automatic rollout.
The investigation also triggered a broader review of the certificate chain. Issuers and certificates were organized in the correct namespace, the CA was separated from the service certificate, and sync waves began expressing the order among cert-manager, certificate issuance, External Secrets, ClusterSecretStore, and the managed ExternalSecrets.
It was a good reminder that “renewed certificate” and “application using renewed certificate” are two different conditions.
One problem revealed another
During the same investigation, another symptom appeared:
failed to get cpu utilization: unable to fetch metrics from resource metrics API:
the server could not find the requested resource (get pods.metrics.k8s.io)
The cluster had Prometheus, node-exporter, and kube-state-metrics, but it did not have metrics-server. These components serve different purposes: Prometheus collects and stores observability metrics; metrics-server provides the Resource Metrics API used by commands such as kubectl top and by autoscaling mechanisms.
metrics-server became another Application managed by Argo CD, configured to reach the OKE kubelets.
At first, the certificate problem and the Resource Metrics API error looked unrelated. In the end, both pointed to the same thing: the cluster no longer needed only new components; it needed a more consistent way to be operated.
Operating the HomeLab through a new interface
One of the most important changes was not a new controller inside the cluster, but a new way to interact with it.
The change began in the repository itself. Kustomize overlays were rendered, local Helm charts were tested, manifests gained schema validation with kubeconform, and Gitleaks began checking history and content before commits and pushes.
With Git acting as the interface for change, I still needed a safe way to inspect the platform without bypassing that workflow.
Argo CD gained a dedicated local account called mcp, with permission to generate tokens and read-only RBAC.
This account powers an Argo CD MCP server used by Codex. The integration can list Applications, query synchronization states, and help with investigations without receiving permission to change the cluster.
The most important detail was the boundary itself. The AI tool did not need administrative access to be useful. Reading state, logs, metrics, and manifests already provided enough context for much of the diagnostic work. When a change is required, it still happens in the repository and goes through the same review and validation flow.
It is less “an AI controlling my cluster” and more “an additional interface for understanding a declarative platform.”
What really changed
Comparing the current environment with Part 1, the difference is not only the number of components.
- I had metrics. Now alerts try to separate transient symptoms from actionable problems.
- Certificates were renewed automatically. Now the workloads consuming them also react to renewal.
- The internet left traces in the logs. Now those traces feed analysis and gateway policies.
- Versions were updated whenever I remembered. Now Renovate maintains a steady flow of small changes.
- The repository described the cluster. After these changes, it also began validating, protecting, and explaining how the cluster should evolve.
None of this made the HomeLab infallible. It can still break, especially because it will keep changing. The difference is that future failures are more likely to be detected, explained, and turned into permanent improvements.
Building Was Only the Beginning
The first version of the HomeLab answered the question: “can you run a complete cloud-native stack on OCI’s Free Tier?”
The answer remains yes.
But these months brought a more interesting question: “can I operate it without depending on memory, luck, and manual commands?”
There is still no definitive answer. The lab remains a lab. Technical debt remains, there are choices I would probably make differently, and several ideas are still waiting for their turn.
Even so, the biggest change has already happened. The HomeLab is no longer just a collection of interesting tools running on Kubernetes. It gained feedback loops: observe, alert, investigate, fix in Git, validate, and learn from each failure.
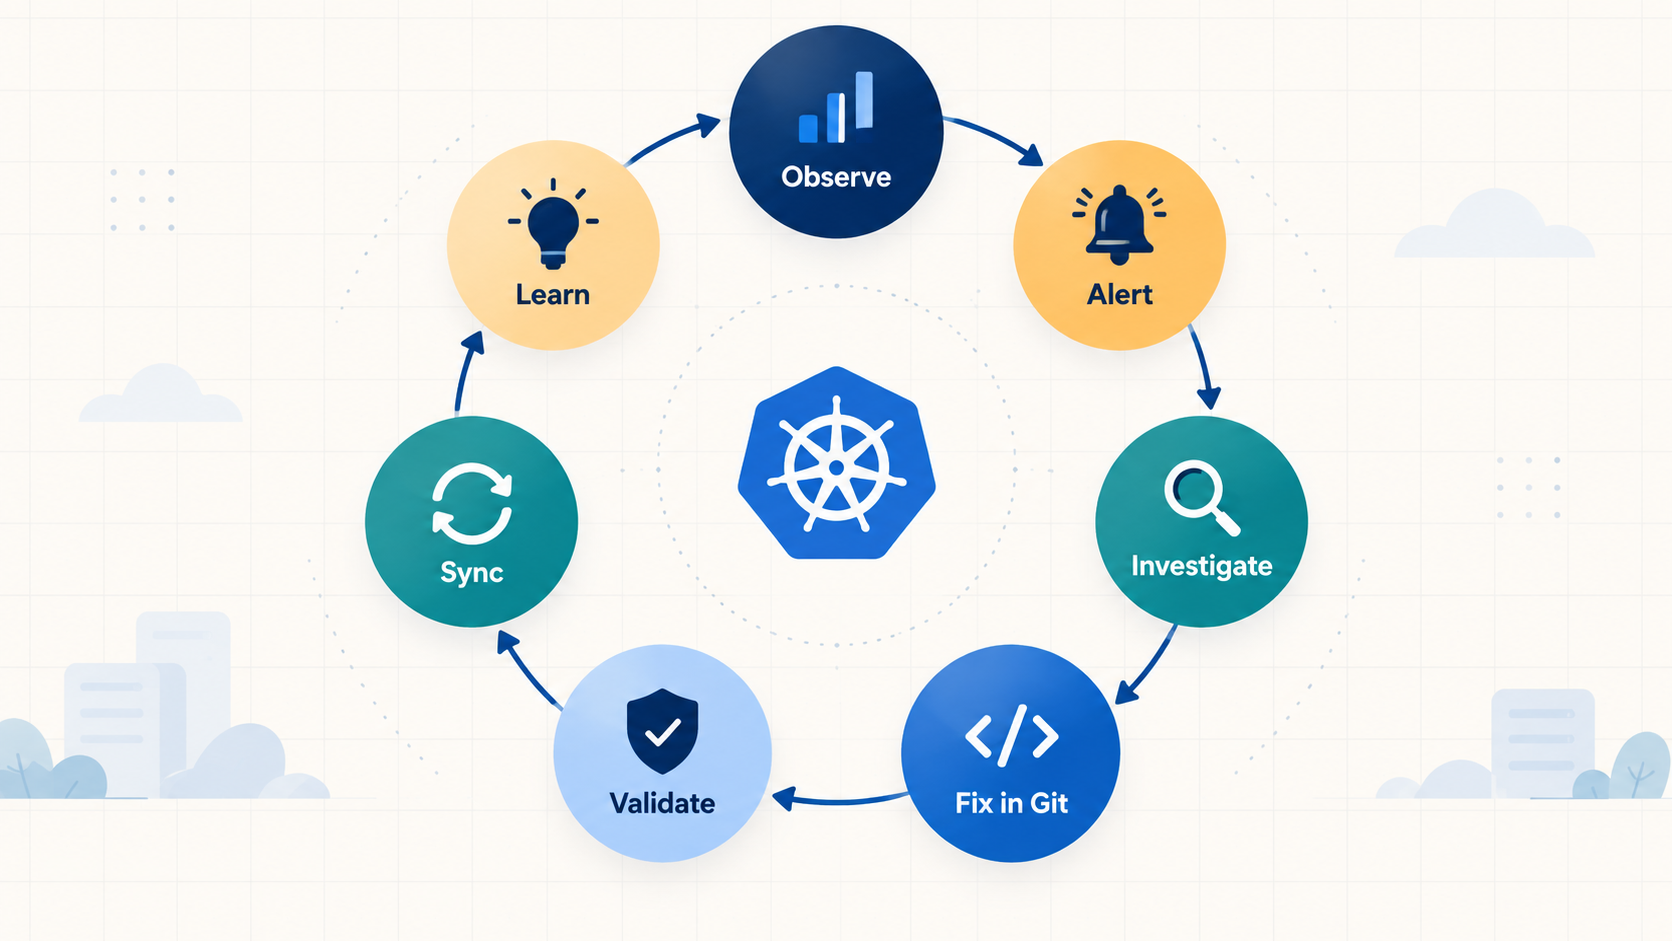
Building the cluster was the visible part. Turning it into a platform happened afterward, one failure, one investigation, and one commit at a time.
Links
Infrastructure and GitOps
- Home Lab on OCI's Free Tier, Part 1
- OCI Free Tier
- Oracle Kubernetes Engine
- Kubernetes
- Terraform
- Renovate
- Argo CD
- Istio Ambient Mode
- Cilium and Hubble
Identity and security
Observability
Applications and tools
💡 Who am I?
I’m Gabriel Carmo, a CNCF Kubestronaut holding the CKA, CKAD, CKS, KCNA, and KCSA certifications, as well as Red Hat Certified OpenShift Administrator.
I work in DevOps Engineering, building and evolving multi-cloud Kubernetes platforms. My work focuses on reducing engineering teams’ cognitive load through platform engineering, automation, GitOps, and self-service experiences.
In my daily work, I connect infrastructure as code, cloud networking, governance, security, observability, and SRE practices to build more standardized, resilient, and operable platforms.