

There's a specific moment every infrastructure engineer goes through. You open your cloud bill, stare at a number that's hard to justify for a personal project, and think: "there has to be a better way." That was me.
I wanted an environment where I could run production-grade tooling, experiment with new patterns, and actually host my own stuff — without the AWS or GCP bill that comes with it. So I gave Oracle Cloud Infrastructure's Always Free tier a serious shot. Two years later, it's still running. And honestly, it's been better than I expected.
This isn't a tutorial or a how-to guide. It's the story of a homelab built gradually over two years inside OCI — shaped by real usage, real failures, and whatever I happened to need to learn next.
Why OCI, and What "Always Free" Actually Means
Most cloud providers have a free tier. Most of those free tiers are either time-limited (12 months, then it expires) or so constrained they're only useful for tutorials. OCI's Always Free tier is different — it doesn't expire, and the resource allowances are genuinely usable.
The headline feature for Kubernetes workloads is the **Ampere A1** instance family, built on ARM64 processors from Arm Holdings. The Always Free plan gives you:
- 4 OCPUs and 24 GB of RAM** total across Ampere A1 instances
- 200 GB of block storage**- **10 TB of outbound data transfer per month
That's enough to run a full observability stack, a service mesh, an identity provider, CI/CD runners, and actual applications. All at the same time.
There's one constraint worth knowing upfront: everything has to be **ARM64-compatible**. A few older container images only publish `amd64` builds, so those are out. But the modern cloud-native ecosystem Kubernetes operators, Helm charts, monitoring tools almost universally publishes multi-arch images. In practice, this hasn't been a real problem.
Provisioning the Cluster with Terraform
The cluster runs on Oracle Kubernetes Engine (OKE), OCI's managed Kubernetes service. With OKE, Oracle manages the control plane at no cost — even on the free tier.
Everything is provisioned via Terraform from day one. No clicking through the OCI console, no manual configuration. The Terraform code handles:
- VCN (Virtual Cloud Network) with public and private subnets
- OKE cluster with a managed control plane
- Node pool with 2
VM.Standard.A1.Flexinstances — 2 OCPUs and 12 GB RAM each, running ARM64
The reason this matters: lab environments get torn down and rebuilt. Sometimes you want to test a major upgrade. Sometimes something breaks badly enough that starting fresh is the right call. With Terraform, rebuilding the entire cluster is a terraform apply away. That peace of mind is worth a lot.
You can use this repository as a base to create your own cluster: https://github.com/nce/oci-free-cloud-k8s. I used it as a starting point for my own infrastructure.
GitOps with ArgoCD: Everything Comes from Git
Once the cluster is up, the next question is: how do you manage what runs on it? The answer here is pure GitOps via ArgoCD v3.2.3.
Nothing gets installed manually. Every application, every Helm chart value, every Kubernetes resource is declared in a Git repository and applied by ArgoCD. If it's not in Git, it doesn't exist in the cluster.
The App of Apps Pattern
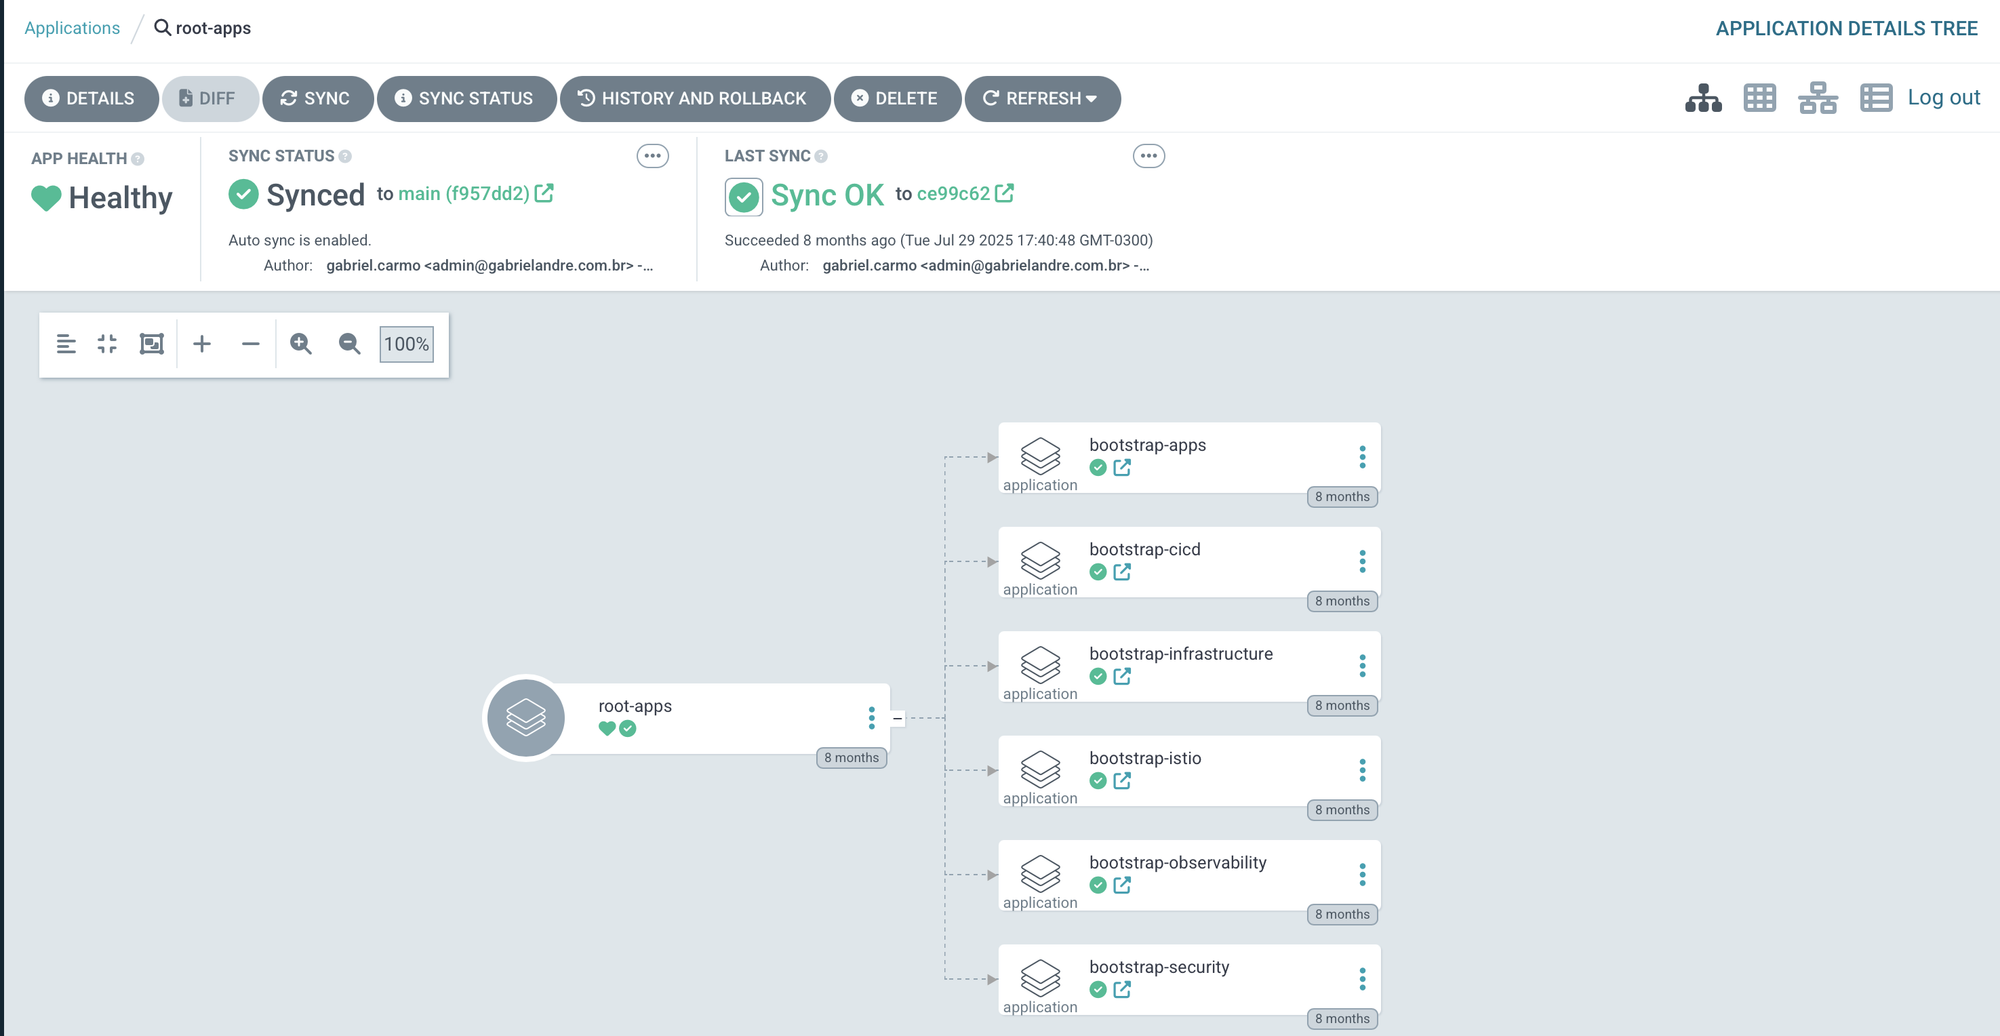
ArgoCD is bootstrapped with a single root application (root-app). That application references a set of other ArgoCD Applications and ApplicationSets which in turn manage everything else. This is the App of Apps pattern, and it means ArgoCD manages its own configuration along with everything else declaratively.
root-app
├── bootstrap-infrastructure → namespaces
├── bootstrap-istio → istio-base, istiod, ztunnel, cni, ingress
├── bootstrap-security → cert-manager, keycloak, external-secrets
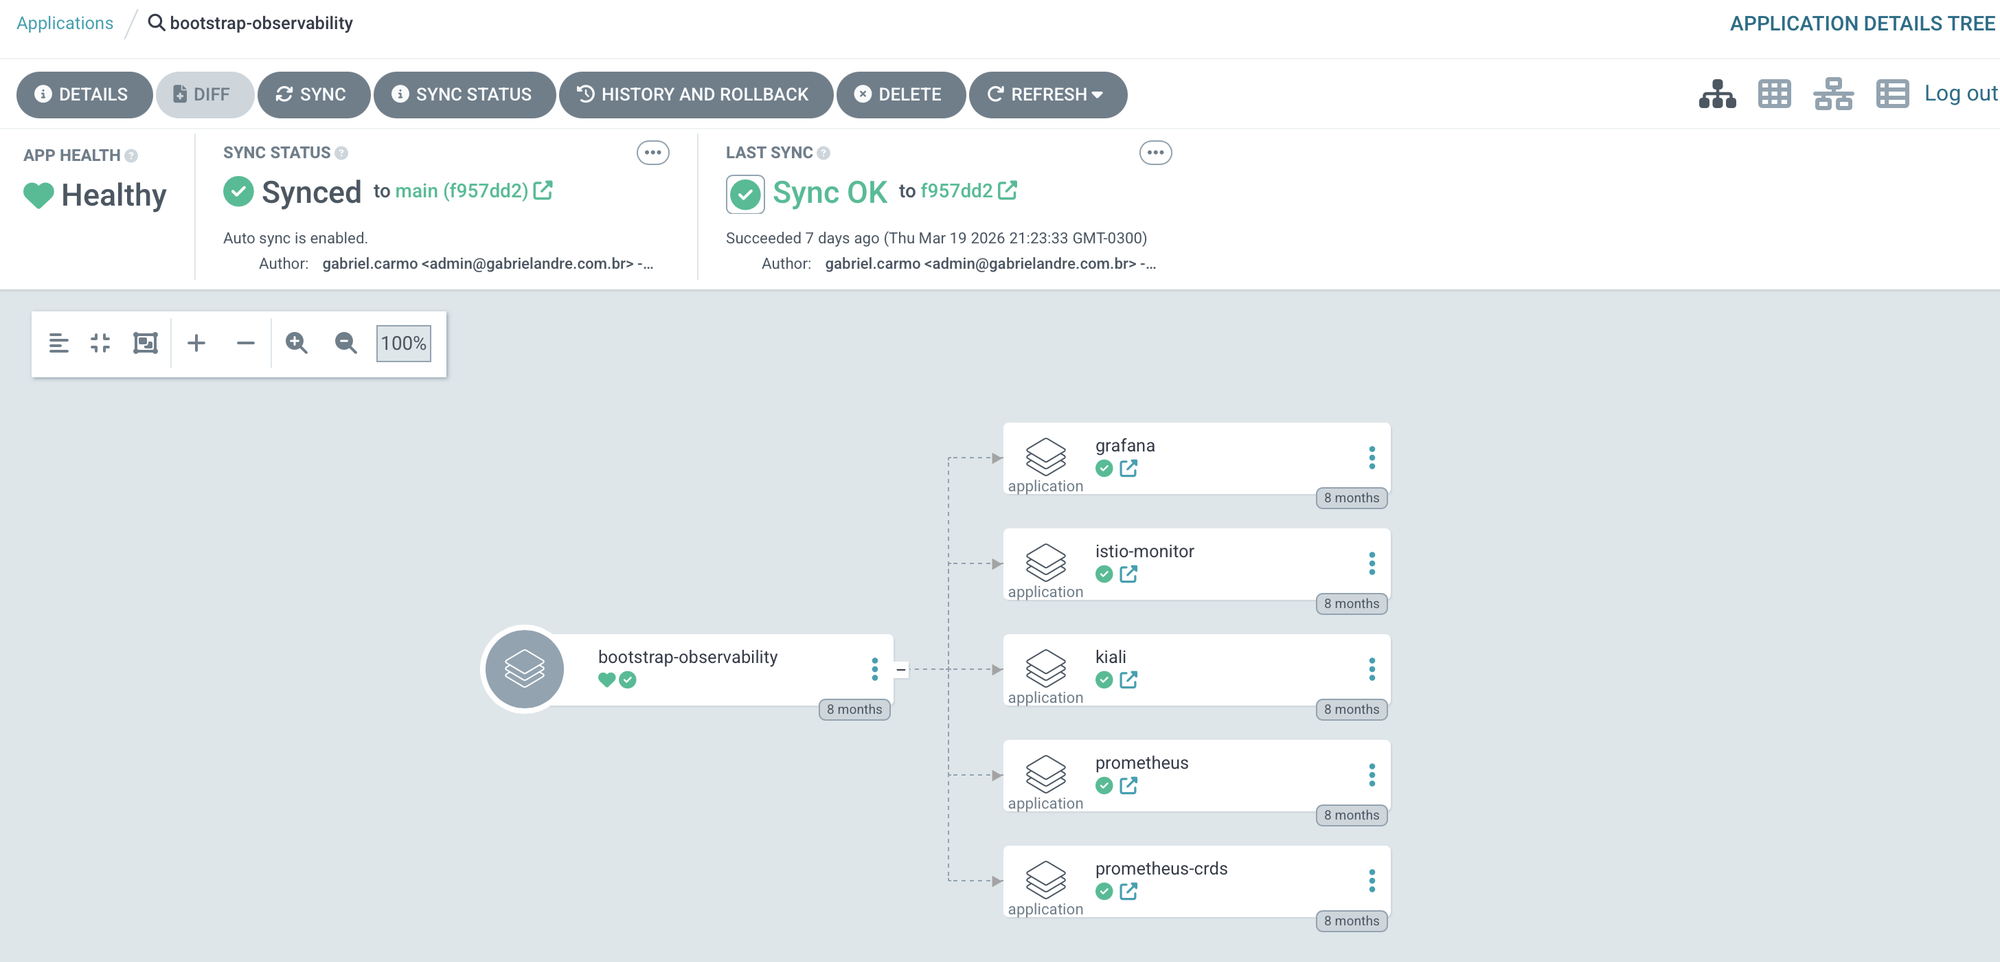
├── bootstrap-observability → prometheus, grafana, kiali
├── bootstrap-cicd → argocd (self-managed), github-runner
└── bootstrap-apps → ghost, outline-wiki
Bootstrapping the entire cluster from scratch is a single command:
kubectl apply -f argocd/root-apps/root-app.yaml
ArgoCD takes it from there. After the initial deploy, ArgoCD starts managing itself. And that's where things get interesting — the root-app deploys each group of applications independently. Some of those Apps are experiments with things I find interesting, others are the foundation for running other applications on top.
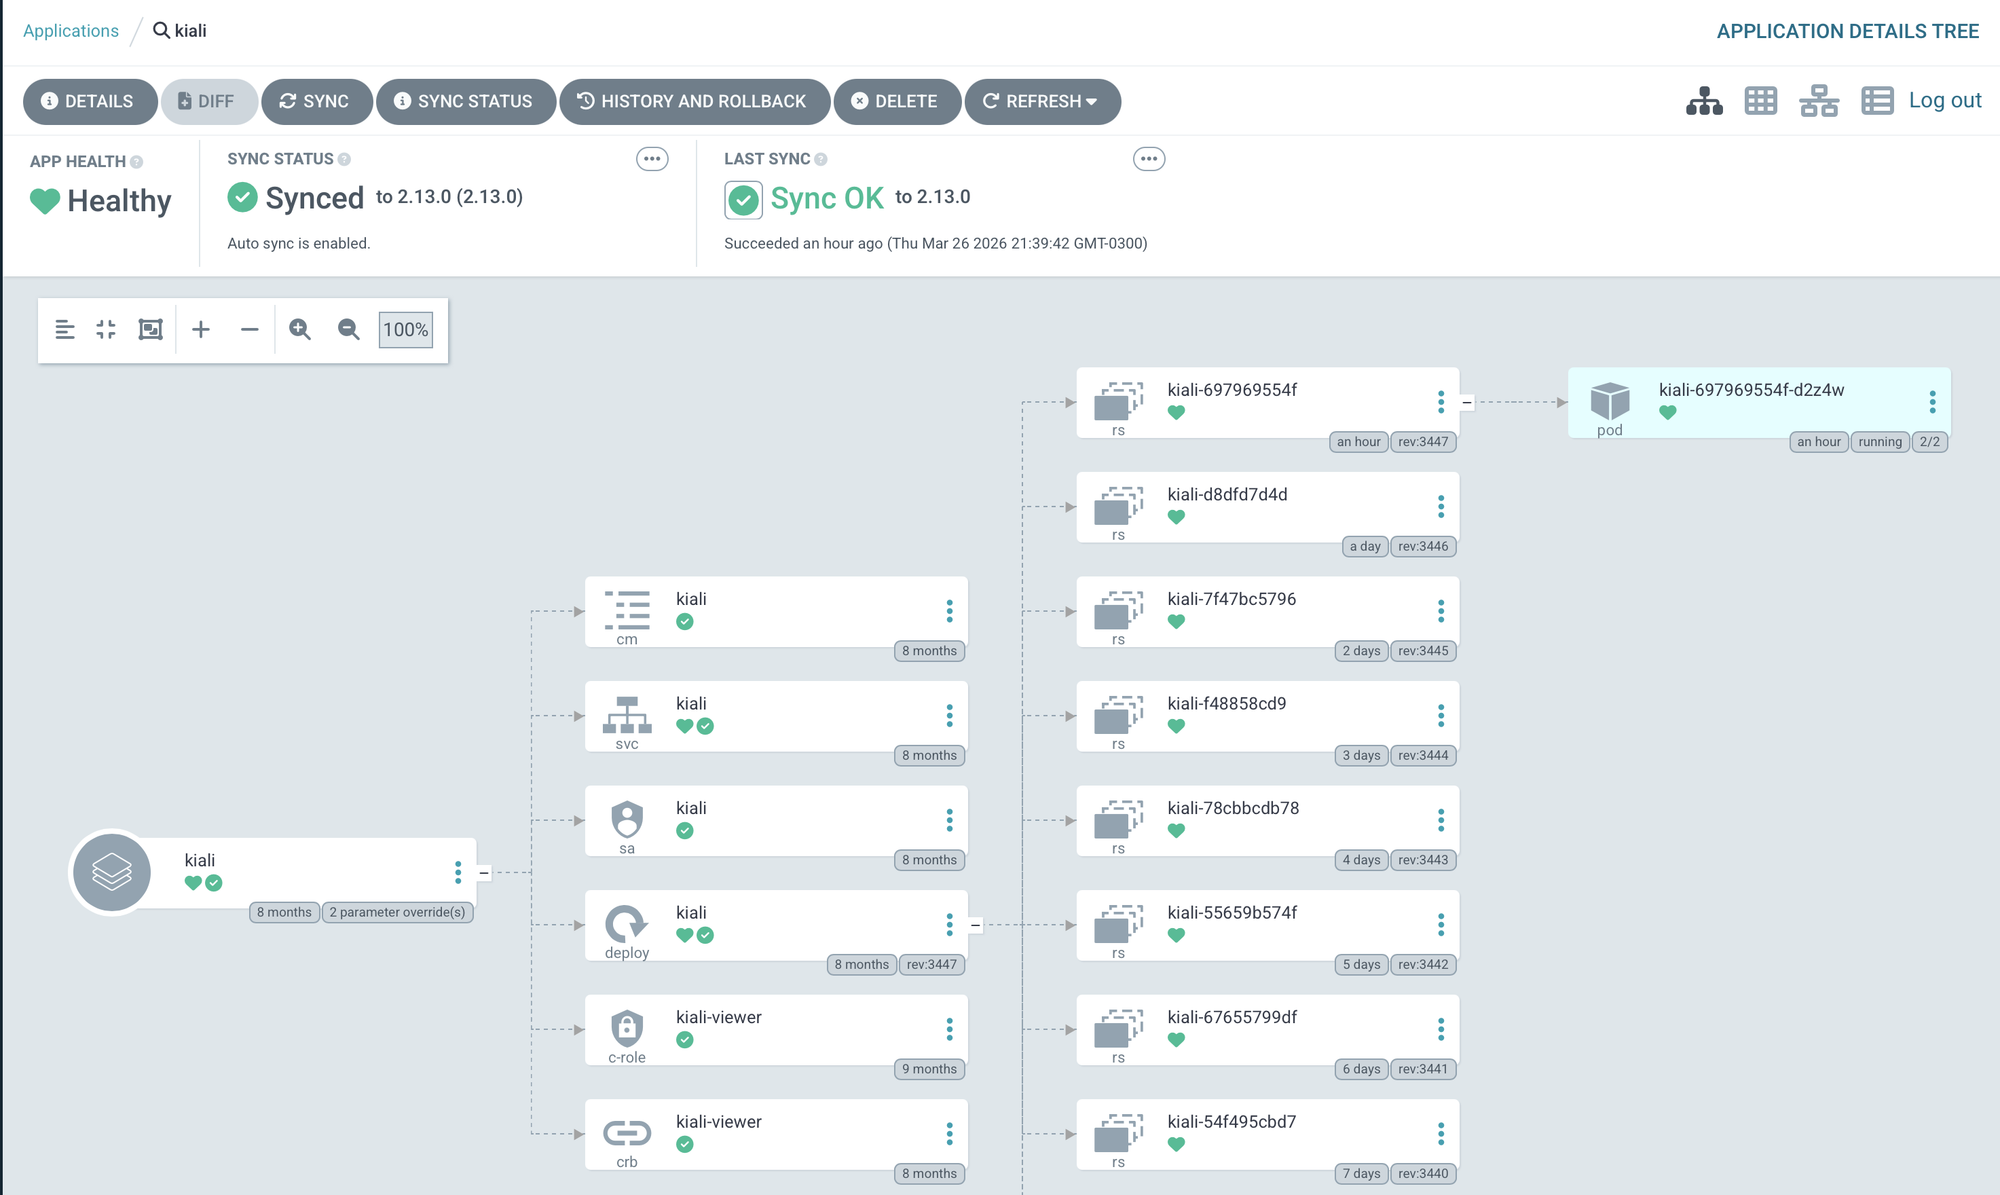
Kiali is up and accessible via a Virtual Service managed by Istio. Want to try it yourself?
Lest go
kiali.gabrielandre.com.br — small caveat though: I lost my Keycloak instance a while back, so logging in won't work. That's lab life.
Sync Waves: Dependency Ordering Without Scripts
Some components have hard dependencies on others. Prometheus CRDs need to exist before the main stack deploys. Istio needs to be running before applications that rely on it come up. Kiali needs both Prometheus and Grafana before it can function. Rather than managing this with complex bootstrap scripts or manual sequencing, ArgoCD handles it with Sync Waves. Each Application gets an annotation that places it in an ordered "wave":
annotations:
  argocd.argoproj.io/sync-wave: "1"
The ordering in this cluster follows the dependency chain naturally:
- Wave 0 — Grafana, because other services depend on it for auth and it needs to be healthy first
- Wave 1 — Prometheus and the Istio control plane
- Wave 5 — Kiali, which won't function without both Prometheus and Grafana already up
No bootstrap scripts, no manual coordination. The wave annotation does the work. It's elegant: the dependency graph lives in the manifests, not in external scripts.
Istio in Ambient Mode: A Service Mesh Without the Overhead
One of the more interesting decisions in this setup is running Istio 1.26.3 in Ambient Mode instead of the traditional sidecar model.
The Problem with Sidecars on a Resource-Constrained Cluster
In classic Istio, every pod gets an Envoy sidecar automatically injected. The sidecar intercepts all traffic, handles mTLS encryption, and generates telemetry. It works — but each sidecar consumes CPU and memory. On a cluster with 2 OCPUs and 12 GB per node, that overhead adds up fast.
Ambient Mode takes a completely different approach. Instead of per-pod sidecars, it uses two shared components:
- ztunnel: a lightweight proxy that runs as a DaemonSet on each node. It handles L4 mTLS encryption for all pod-to-pod communication transparently, without touching the pods themselves.
- Istio CNI: a network plugin that redirects pod traffic through the ztunnel without any application-side configuration.
The result: automatic mTLS between every service in the cluster, L4 telemetry, and zero per-pod overhead. When you actually need L7 features — header-based routing, retries, circuit breaking — you deploy Waypoint Proxies selectively, only for the services that need them. Not everything does.
The ArgoCD configuration makes the mode explicit:
helm:
  values: |
    profile: ambient
    resources:
      requests:
        cpu: 10m
That cpu: 10m request says it all. Classic Istio istiod would ask for significantly more. Ambient Mode runs on a fraction of that — which, on a free-tier cluster, is exactly the point.
The Security Stack: TLS, Identity, and Secrets Management
Cert-Manager v1.18.1 — Automatic TLS Everywhere
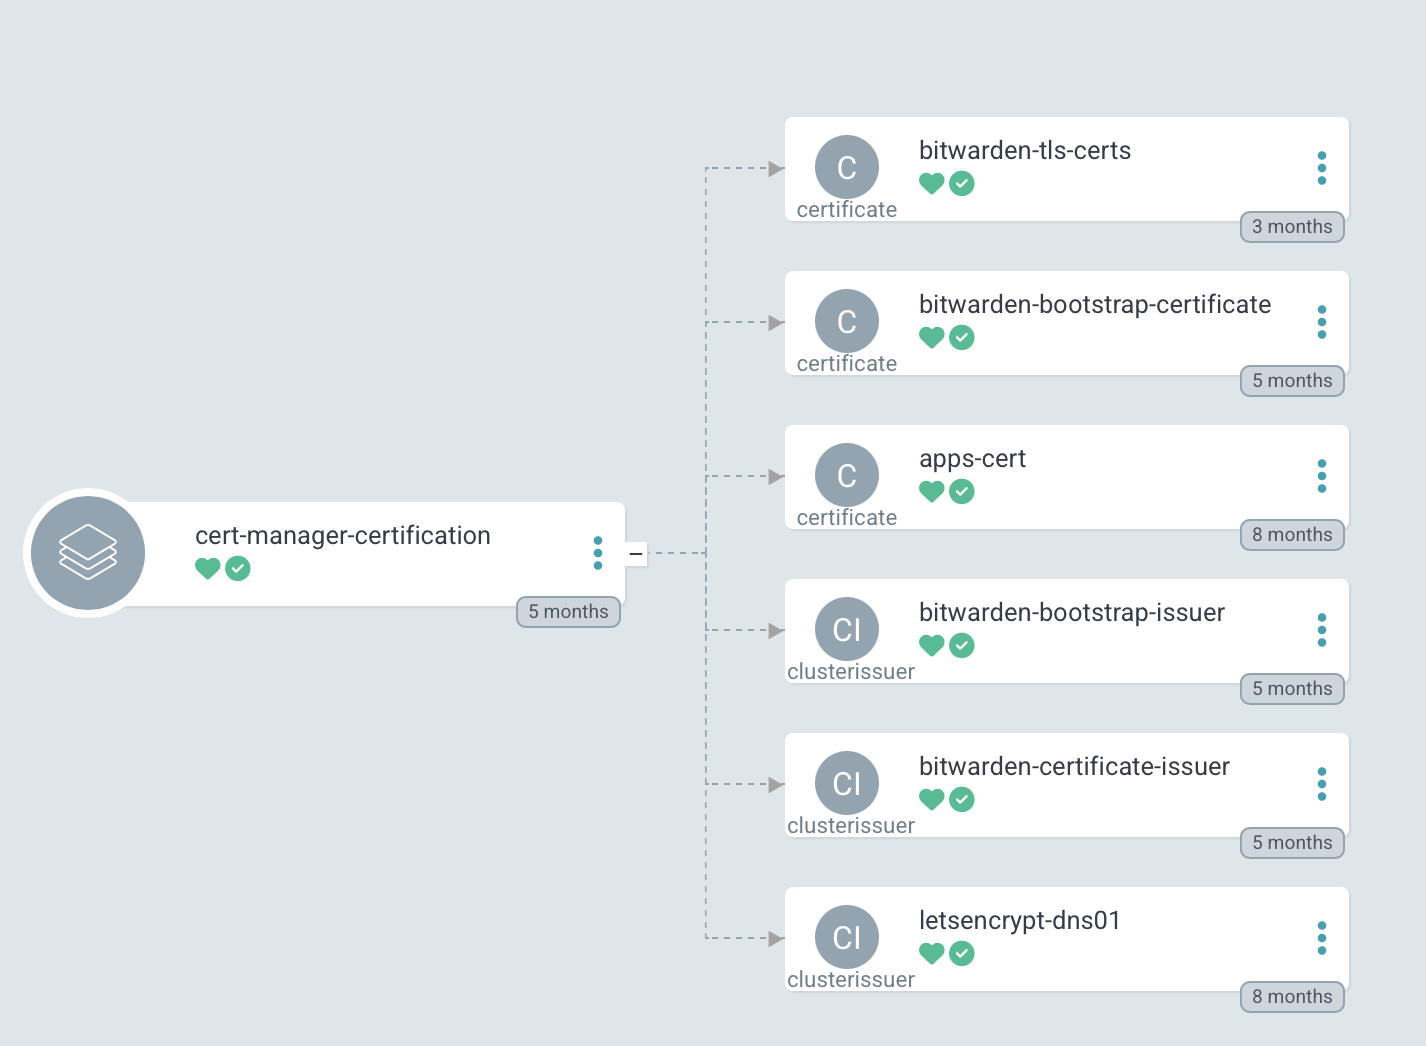
Every externally-exposed service runs HTTPS. Certificate management is handled entirely by Cert-Manager v1.18.1, using Let's Encrypt certificates issued via the DNS-01 challenge. The choice of DNS-01 over HTTP-01 is deliberate: it supports wildcard certificates and works even for services that aren't publicly accessible.
The DNS provider is Cloudflare, and Cert-Manager uses a ClusterIssuer with Cloudflare API credentials — injected via secrets, as we've already seen. When a new service needs TLS, you create a Certificate resource pointing to the issuer and walk away. Cert-Manager handles validation, issuance, and renewal automatically.
And yes — this is also deployed by ArgoCD. Same pattern, all the way down.
Keycloak v26.4— A Single Identity Provider for Everything
Is the central Identity Provider for the entire environment. Grafana, Kiali, Outline Wiki, and ArgoCD all delegate authentication to Keycloak via OIDC/OAuth2. One login, one user database, one place to manage access.
Keycloak is installed via Helm Chart from an OCI registry — treating the chart like a container image, with versioned pulls and digest pinning:
sources:
  - repoURL: oci://registry-1.docker.io/cloudpirates/keycloak
    chart: keycloak
    targetRevision: 0.8.0
Adding a new service with SSO is now a consistent process: create a Client in the Keycloak realm, configure the service to point at Keycloak's OIDC issuer, and let External Secrets inject the client secret. No manual credential distribution.
Sim tenho que configurar todos os apps novamente para aceitar auth com keycloak, mas isso e um lab, entao atualmente esta como debito tecnico.
External Secrets Operator v0.20.4 + Bitwarden — Zero Secrets in Git
Nothing sensitive lives in Git. Every credential, API key, token, and certificate is stored in Bitwarden Secrets Manager and synced into the cluster by the External Secrets Operator v0.20.4.
The flow is straightforward: a secret is created in Bitwarden and associated with a project. An ExternalSecret resource in the cluster defines which fields to fetch and which Kubernetes Secret to materialize them into. The ESO authenticates to Bitwarden via a ClusterSecretStore, and the secret shows up in the correct namespace as a standard Kubernetes Secret — no manual copying, no environment variables hardcoded anywhere, no secrets in commit history.
It's one of those things that feels like extra setup upfront, but becomes invisible once it's running. And you stop worrying about accidentally pushing something you shouldn't.
apiVersion: external-secrets.io/v1beta1
kind: ClusterSecretStore
spec:
  provider:
    bitwarden:
      organizationId: <bitwarden-org-id>
      projectId: <bitwarden-project-id>
ArgoCD itself uses a complementary mechanism — the $secret-name:key syntax — to inject secrets directly into Helm values at sync time, without ever writing them to Git:
helm:
  parameters:
    - name: auth.openid.client_secret
      value: $kiali-secrets:client_secret
The result: the Git repository is entirely safe to be public. Every credential flows through Bitwarden → ESO → Kubernetes Secret, with no stops in a config file. No exceptions.
Observability: Prometheus, Grafana, Kiali
kube-prometheus-stack - The Foundation
The observability stack starts with kube-prometheus-stack v75.10.0, which in a single Helm chart installs:
- Prometheus — metrics collection and storage
- AlertManager — alert routing and management
- Node Exporter — OS-level metrics from each node
- kube-state-metrics — metrics about Kubernetes objects
- Prometheus Operator — declarative management via
ServiceMonitor,PodMonitor, andPrometheusRuleCRDs
One important decision: Grafana is installed separately, with grafana.enabled: false in the stack values. This decouples Grafana's lifecycle from the rest of the stack and allows independent versioning.
Two configuration flags that are easy to overlook but matter in a multi-component environment:
serviceMonitorSelectorNilUsesHelmValues: false
podMonitorSelectorNilUsesHelmValues: false
These tell Prometheus to discover all ServiceMonitor and PodMonitor resources in the cluster, regardless of labels. Without this, Prometheus would only scrape targets matching specific label selectors — and Istio's metrics wouldn't be collected automatically.
That said, this approach makes sense for a lab, where the goal is visibility into everything. In a real production environment, scraping indiscriminately is a problem — especially with limited storage. A proper follow-up would be narrowing down which services actually produce useful metrics and filtering everything else out. That's on the list.
Grafana v10.1.4 — Persistent Dashboards with PostgreSQL and SSO Keycloak
Grafana runs as its own ArgoCD Application at wave 0 — Kiali depends on it, so it needs to be up before anything else.
A few decisions worth mentioning: the backend is PostgreSQL, not SQLite. That means dashboards, preferences, and sessions survive restarts and upgrades without losing anything. Authentication is via OAuth2 with Keycloak, so there are no local Grafana credentials to manage. Prometheus is the default datasource, pointing directly to the internal service endpoint. And the official Istio dashboards are imported via script — no manually copying and pasting JSON.
Kiali v2.13.0 — Seeing the Service Mesh
Kiali v2.13.0 is the visualization layer for the Istio service mesh. It shows service topology, traffic metrics, service health, and lets you inspect Istio configuration in real time — the kind of visibility that makes debugging a lot less painful.
The Kiali integration is also a good example of how the different pieces of the stack actually connect: credentials injected via External Secrets, telemetry coming from Prometheus, and authentication handled through OpenID Connect via Keycloak — closing the SSO loop for the entire observability layer.
helm:
  parameters:
    - name: auth.openid.client_secret
      value: $kiali-secrets:client_secret
    - name: external_services.grafana.auth.token
      value: $kiali-secrets:grafana_token
external_services:
  grafana:
    internal_url: http://grafana.observability.svc.cluster.local:80
    external_url: https://dashboard.gabrielandre.com.br:443
    auth:
      type: bearer
  prometheus:
    url: http://prometheus-kube-prometheus-prometheus.observability.svc.cluster.local:9090
The Applications
Ghost CMS v5.92 — Personal Blog
The personal blog runs on Ghost CMS v5.92. If you've never used Ghost, the premise is simple: an open-source platform focused on doing one thing well — writing and publishing. No endless plugins, no configuration that turns into a side project, no feeling like you're fighting the tool every time you want to write a post.
I chose Ghost for three reasons. It's open-source and self-hosted, so the articles live on my server, in my repository, under my control. The writing interface is clean enough to stay out of the way. And it publishes official multi-arch images, so running on OCI's ARM64 didn't require any workarounds.
The deployment uses a custom Helm chart maintained in the repository, giving full control over resource limits and Istio integration — consistent with everything else in the lab.
Outline Wiki — Personal Knowledge Base
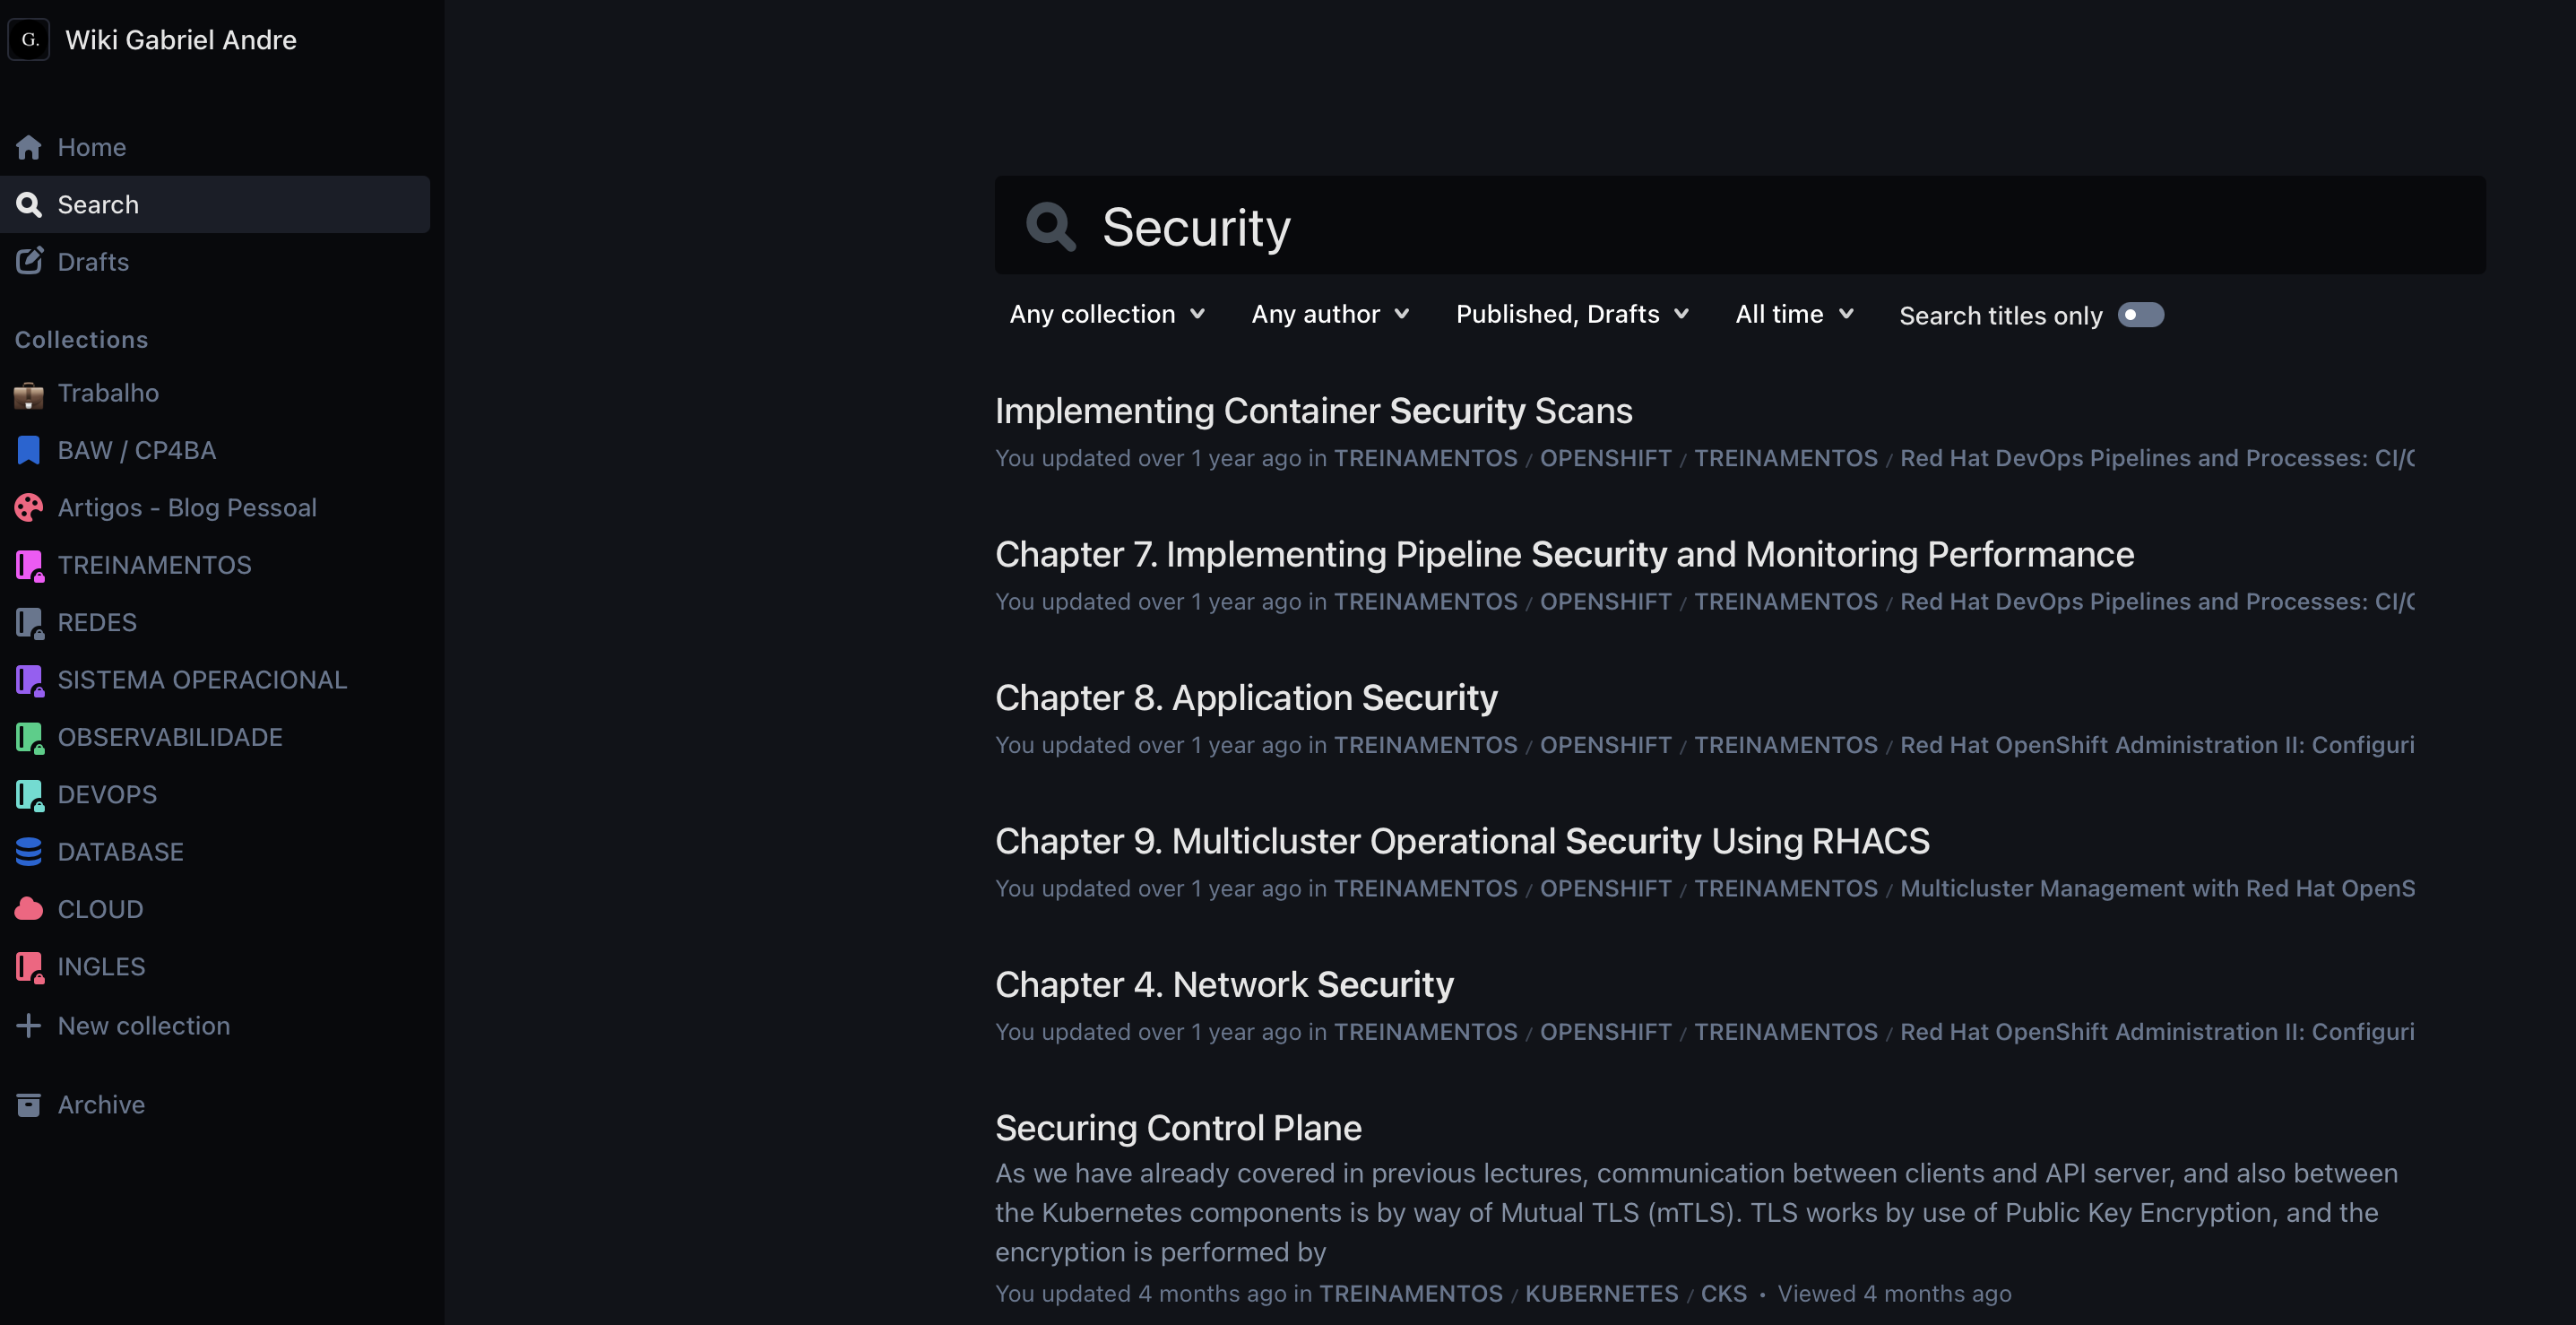
Outline is an open-source collaborative documentation tool — think self-hosted Notion, with Markdown support, collection hierarchies, real-time search, and a UI that actually gets out of your way when you're writing. It's where runbooks, notes, training materials, and technical references live.
My wiki at docs.gabrielandre.com.br has grown to over 900 documents — K8s, Docker, Podman, Linux, OpenShift, Dynatrace, Zabbix procedures, plus study notes on a wide range of topics. The project itself is modern and well-structured, with an active community contributing improvements and bug fixes.
There's a lot more to say about Outline — setup, integrations, how I organize content. That deserves its own article, and it's coming.
In Migration to Kubernetes
Docker Compose was the right starting point fast to deploy, simple to operate. But with a running Kubernetes cluster on the same OCI infrastructure, the natural next step is migrating Outline into the cluster
Current Architecture: Docker Compose on the OCI VM
The wiki currently runs on the same OCI VM as the other supporting services, managed by Docker Compose. Five services share a dedicated Docker bridge network (10.11.0.0/24).
MinIO handles file and image storage, replacing what would otherwise be an external S3 service — and one more thing to pay for. On startup, a shell script runs via mc (MinIO Client) to create the storage bucket, create an application user with restricted IAM permissions via a custom policy, and configure public access for the /public folder only. The whole storage setup is self-contained and reproducible. No external dependencies, no surprises.
PostgreSQL and Redis are Outline's standard dependencies — relational storage for documents and collections, cache for sessions and search. Nothing exotic here, just what the app needs to run.
The GitOps Repository Structure
The entire environment is described declaratively in a single Git repository. The structure is designed to be modular — adding a new application or infrastructure component follows a consistent pattern.
.
├── argocd/
│ ├── apps/prod/ # ArgoCD Applications, organized by stack
│ │ ├── cicd/ # ArgoCD self-managed, GitHub Actions
│ │ ├── istio/ # base, control-plane, ztunnel, cni, ingress
│ │ ├── observability/ # prometheus, grafana, kiali
│ │ ├── security/ # cert-manager, keycloak, external-secrets
│ │ ├── infrastructure/ # namespaces, gateway, virtual servers
│ │ └── app/blog/ # ghost, outline-wiki
│ ├── bootstrap/ # App of Apps per category
│ ├── infrastructure/charts/ # Custom Helm charts
│ │ ├── namespaces/ # Standardized namespace chart
│ │ ├── ghost/ # Ghost CMS chart
│ │ ├── outline-wiki/ # Outline Wiki chart (with Iframely)
│ │ ├── grafana/ # Grafana values
│ │ └── keycloak/ # Keycloak values
│ ├── projects/ # ArgoCD Projects (RBAC)
│ └── root-apps/ # root-app.yaml (entry point)
├── scripts/ # Python and shell automation
├── Makefile # Unified command interface
└── readme.md
The split between apps/prod and infrastructure/charts is intentional. The first holds only ArgoCD manifests — what should exist and where. The second holds the custom Helm charts that define how each thing actually gets installed. Keeping intent separate from implementation makes a real difference when you need to change how something is deployed without touching what ArgoCD knows about it.
The stack-based organization inside apps/prod — cicd, istio, observability, security, infrastructure, app — reflects the natural boundaries of the environment. Each stack has its own bootstrap, which means you can sync or debug an entire layer without touching anything else.
The 10 Cluster Namespaces
All namespaces are created by the `namespaces` chart with standardized labels. Every namespace gets `istio-injection: enabled` no manual opt-in required.
| Namespace | Purpose |
|---|---|
argocd |
ArgoCD and GitOps tooling |
istio-system |
Istiod (control plane) |
istio-ingress |
Istio Gateway for external traffic |
cert-manager |
Certificate management |
keycloak |
Identity Provider |
observability |
Prometheus, Grafana, Kiali |
github-runner |
Actions Runner Controller |
blog-pessoal |
Ghost CMS |
outline-wiki |
Outline Wiki + Iframely |
kcsa-prod |
Additional production workloads |
Automation with Python and Make
A significant part of the daily operating experience is encoded in scripts — Python (managed with uv) for YAML manipulation, shell for system operations — all surfaced through a Makefile as a single interface. The goal: any repetitive operation that would require remembering to update multiple files or run a sequence of commands becomes a single make <target>.
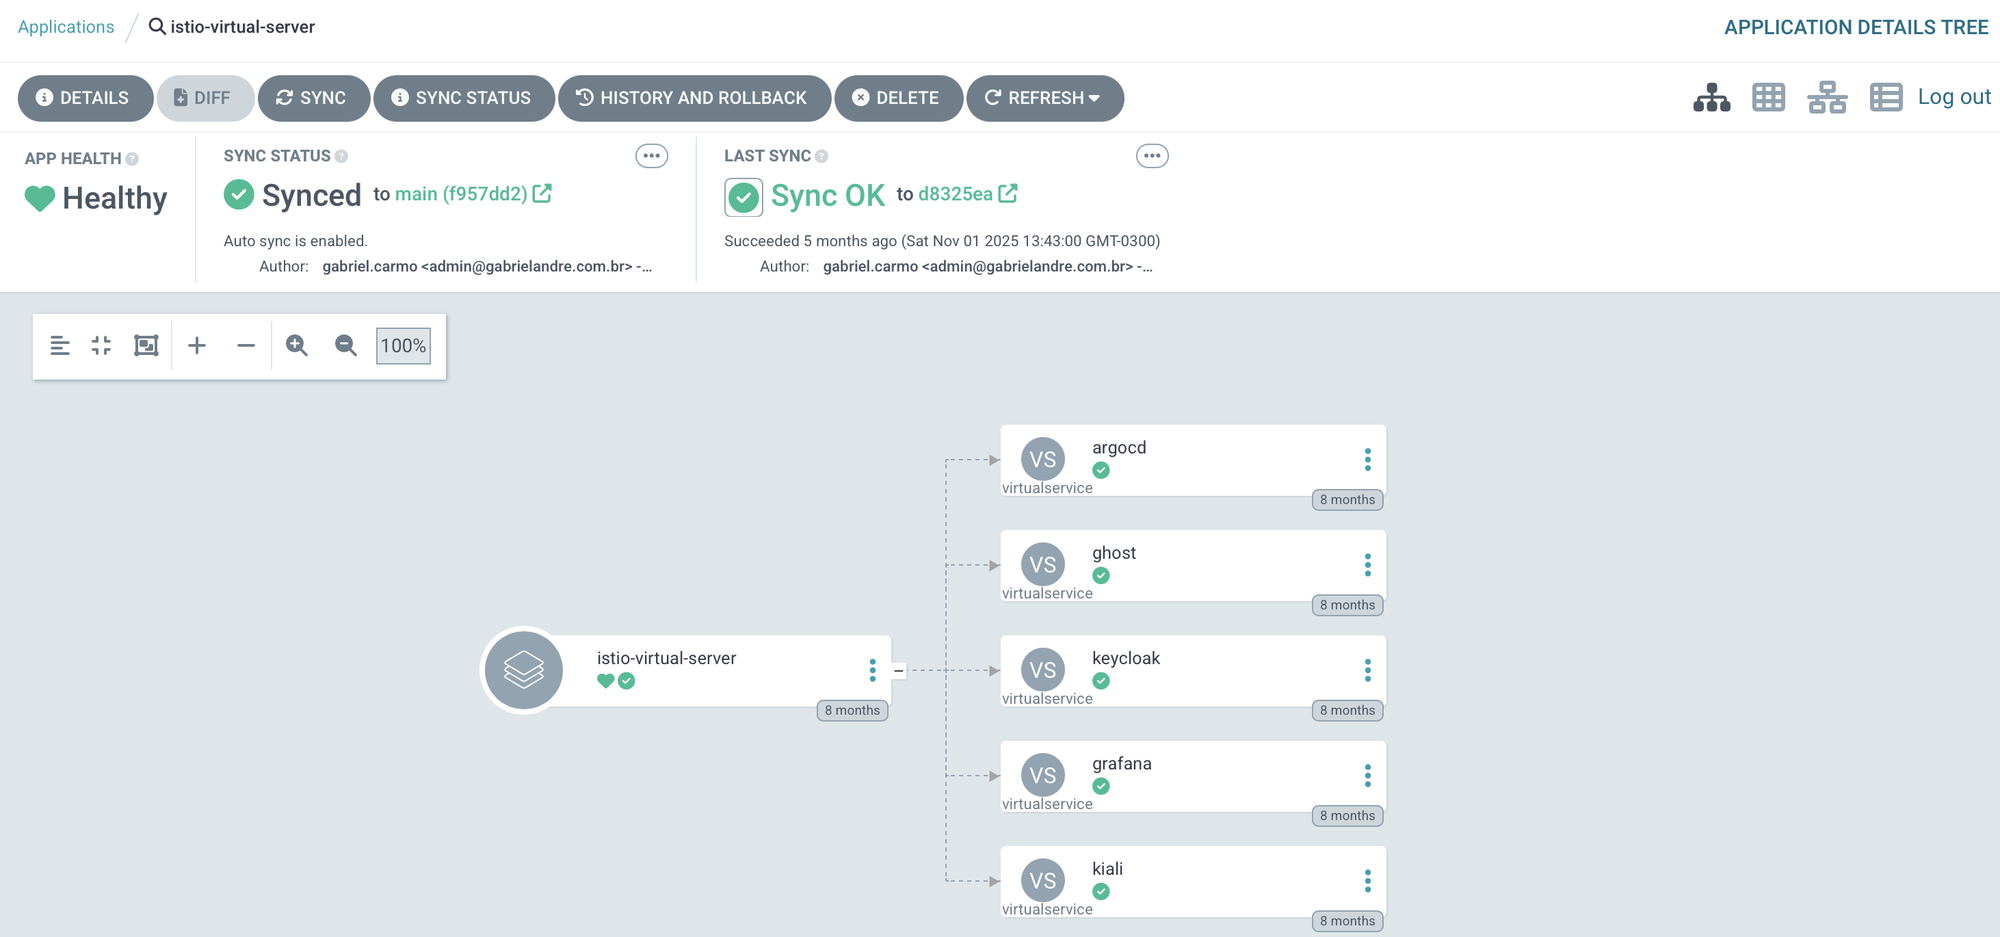
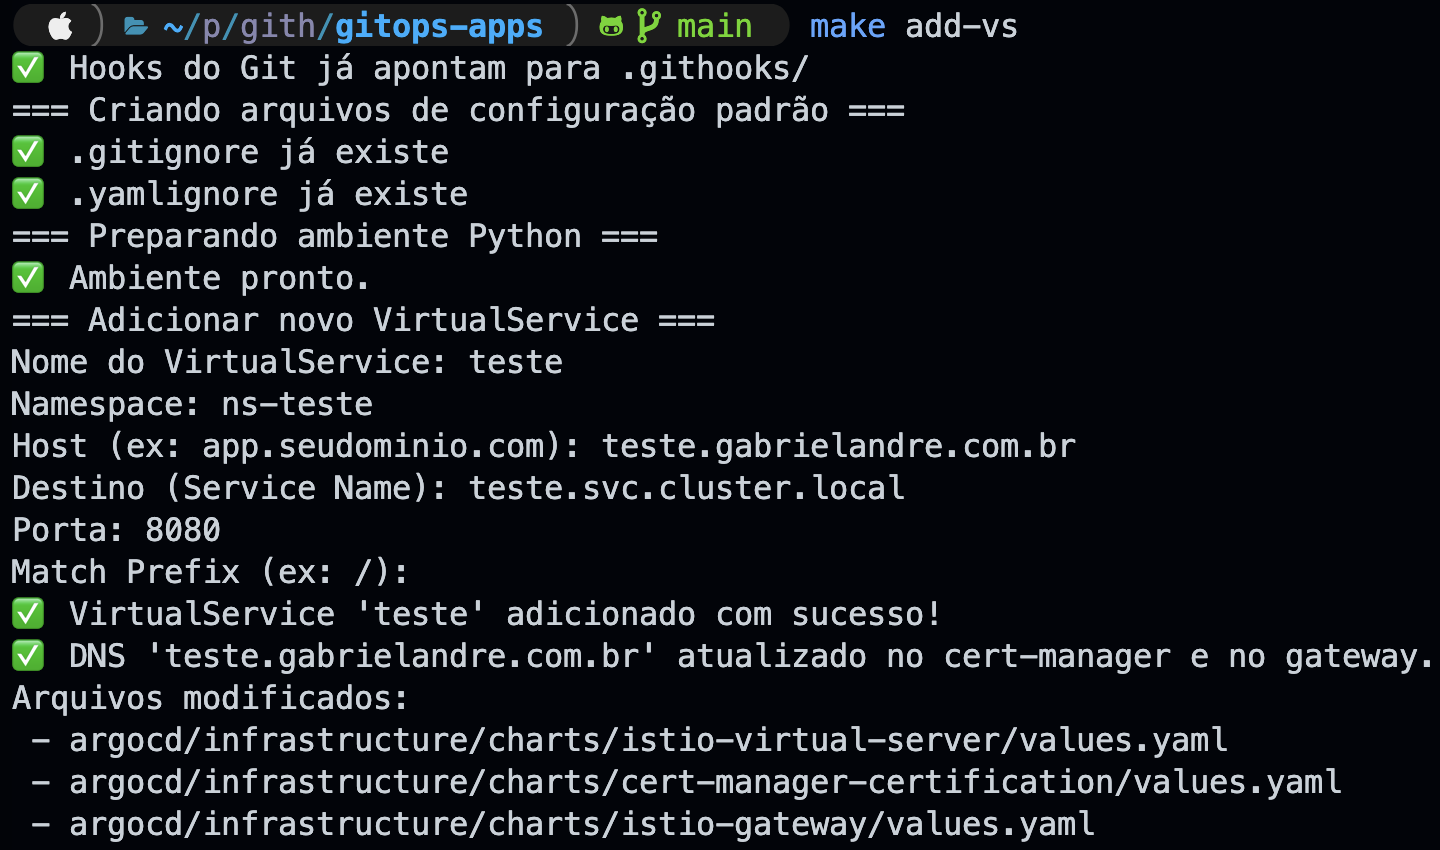
make add-vs - Expose a new service externally
Exposing a new service requires touching three things simultaneously: adding an entry to the VirtualServer, adding the domain to Cert-Manager's dnsNames, and registering the host in the Istio Gateway. Doing this manually across three YAML files is a reliable way to forget something — and when you do, the service simply won't work, without a very clear error telling you why.
add_vs.py handles all of it at once. An interactive prompt — name, namespace, host, destination service, port, and route prefix — and all three files are updated atomically using ruamel.yaml, a library that preserves comments, indentation, and quoting style, keeping diffs clean. And if the host already exists in any of the three files, the script aborts before touching anything.
In the example below, a new VirtualService called teste was created for the host teste.gabrielandre.com.br, pointing to teste.svc.cluster.local on port 8080. One run, three files updated.
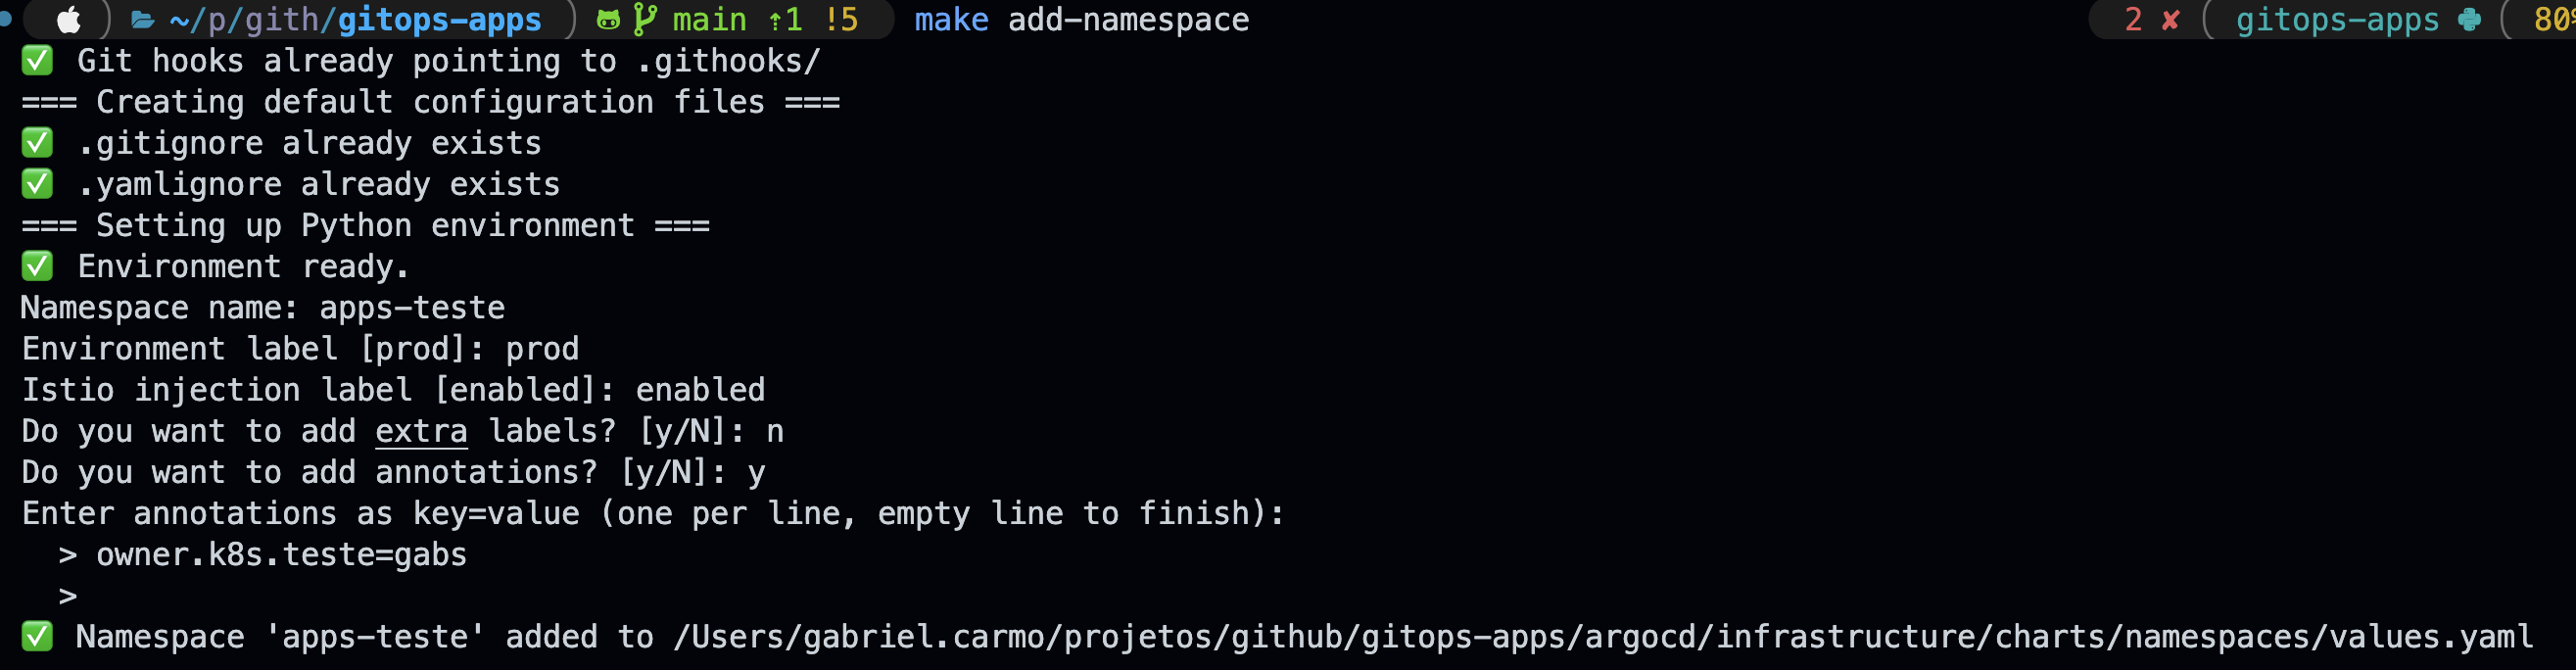
make add-namespace - register a new standardized namespace
All cluster namespaces live in a single values.yaml. No exceptions. The add_namespace.py script inserts a new entry with the correct defaults — name, environment label, Istio injection, and optional annotations — without having to open the file manually and hope you don't break the indentation.
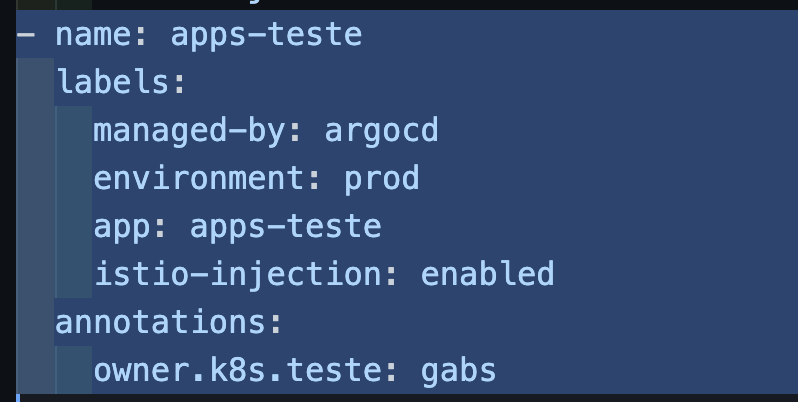
The flow is interactive, same as the previous script. In the example below, a namespace called apps-teste was created in the prod environment, with Istio injection enabled and a custom annotation.
managed-by: argocd
environment: $ENV
app: $NAME_APP
istio-injection: BOOL
The result goes straight into the Helm values.yaml. Open the MR, ArgoCD applies it, done.
make create-argo-app - Generate an ArgoCD Application manifest
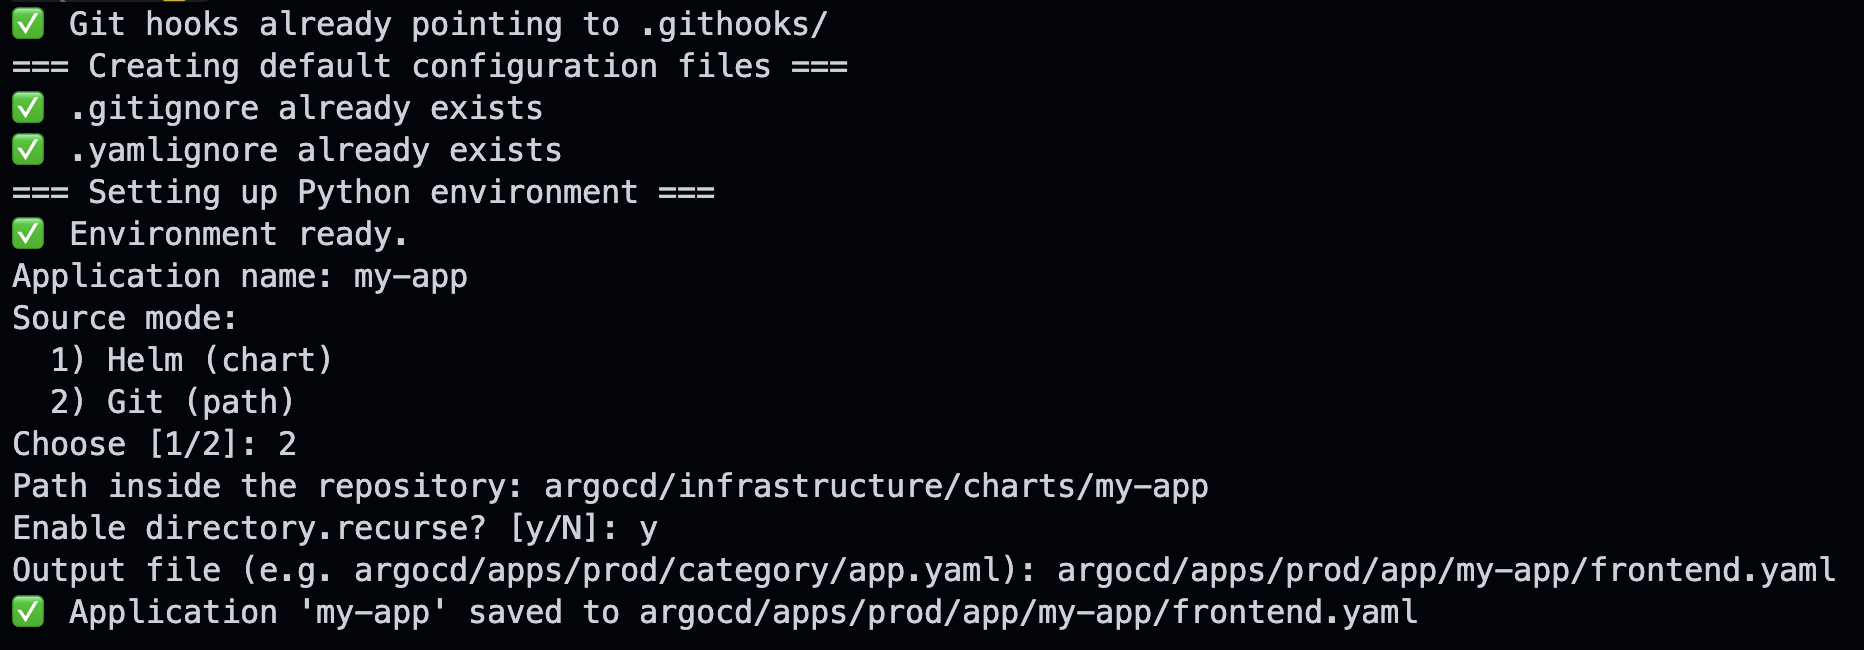
Writing an ArgoCD Application manifest from scratch is tedious and inconsistent. It's easy to forget prune: true, use the wrong namespace, or miss a required field — and you only find out when ArgoCD refuses to sync. create_argo_app.py fixes that by generating manifests with sensible defaults for this project, supporting both Helm Chart mode and Git path mode (Kustomize or plain manifests).
The flow is interactive: the script asks for the application name, source mode, path inside the repository, and where to save the output file. In the example below, a new app called my-app was created in Git path mode, with directory.recurseenabled. Three prompts, one file, done.
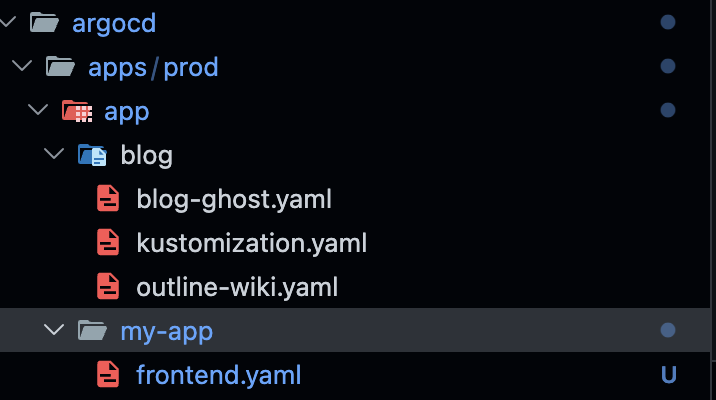
The my-app folder shows up in the repository structure immediately, manifest ready — ArgoCD takes it from there.
make import-istio-dashboards - Import official Istio dashboards into Grafana
Istio publishes official dashboards on Grafana.com. The import script fetches the revision list for each dashboard (IDs: 7639, 11829, 7636, 7630, 7645, 13277), selects the revision matching the current Istio version, and imports via the Grafana API — overwriting previous versions cleanly.
GRAFANA_TOKEN=glsa_xxx make import-istio-dashboards
GRAFANA_ARGS="--host https://dashboard.gabrielandre.com.br"
What's Next:
Renovate Bot for Automated Dependency Updates
One thing that still requires manual attention is keeping component versions current. Right now, knowing that kube-prometheus-stack published a new version means either watching GitHub releases manually or remembering to check periodically. In practice, that means updates happen irregularly.
The obvious fix is Renovate Bot. Renovate is an open-source dependency update tool — similar to Dependabot but with much richer support for cloud-native ecosystems, including Helm charts, container images, and Kubernetes manifests. It's on my list.
Wrapping Up
What started as a way to avoid paying for personal cloud infrastructure turned into a proper home lab — the kind of setup you'd expect from a mature platform team. Declarative GitOps, a sidecar-free service mesh, centralized identity management, secrets that never touch Git, integrated observability, and CI/CD runners running inside the cluster itself. All publishing multi-arch images without any extra configuration.
But this wasn't built in a weekend. It grew slowly, shaped by real needs and whatever I happened to be learning or testing at the time.
The screenshot below is my first commit. The most recent one was pushed on the day I'm writing this: March 3rd, 2026.

None of this came together on day one. Things broke. I broke things — on purpose, mostly. That was always the point. This isn't a blueprint you need to follow. It's just how my lab works, and I wanted to share it.
There's a lot more I could get into — the OCI infrastructure provisioned with Terraform, OKE upgrades, firewall rules for the public load balancer, Istio routing config, and more. But that would make this article unreasonably long.
Links
- [Prometheus](https://prometheus.io/)
- [Grafana](https://grafana.com/)
- [Istio](https://istio.io/)
- [ArgoCD](https://argoproj.github.io/cd/)
- [Keycloak](https://www.keycloak.org/)
- [Cert-Manager](https://cert-manager.io/)
- [External Secrets](https://external-secrets.io/)
- [Ghost](https://ghost.org/)
- [Outline](https://www.getoutline.com/)
💡 Who am I?
I'm Gabriel Carmo, passionate about technology (especially Open Source). I have experience in Cloud, Kubernetes, OpenShift, Zabbix, Dynatrace and much more! Always exploring new technologies and sharing knowledge. 🚀
📬 Let's connect?
🔗 LinkedIn
🐙 GitHub
🦊 GitLab
🏅 Credly
📧 Contato: contato@gabrielandre.com.br